- Information
Technology - Customer
Protection
Commissioners- Inspector
General - Industry
Regulation- The Commission and the Industry We Regulate
- Industry Growth in Volume, Globalization and Complexity
- Growth in Volume of Futures and Option Contracts Traded
- Estimated Annual Swap Event Volume
- Actively Traded Futures and Option Contracts
- Notional Value of Futures/Option Open Contracts
- Notional Value of Exchange-Traded and OTC Contracts
- Customer Funds in Futures Commission Merchants Accounts
- Aggregate Sum of House Origin Margin on Deposit
- Number of Registrants
- Contract Markets Designated by the CFTC
- Number of DCOs Registered with the CFTC
- Exempt Markets
- Industry
Trends- Industry Trends and CFTC Resource Requirements
- Industry Trend 1: Swap Markets are Increasingly Operating Under the Dodd-Frank Regulatory Framework
- Industry Trend 2: Increased Number of Market Participants is Driving Innovation in Derivatives Trading
- Industry Trend 3: Intermediaries are Investing in New Business Processes and Technology
- Industry Trend 4: Heightened Risk Management Practices Seek to Lower Institutional Risk at Clearinghouses
- Industry Trend 5: Market Participants Need to Manage Large Volumes of Data in Order to Adapt to Evolving Derivatives Environment
- Resources
by Goal - Privacy
Policy
Acronyms
Appendix 5. FY 2014 Planned Resources by Strategic Goal
Goal One Planned Resources
Goal One: Protect the public and market participants by ensuring market integrity; promoting transparency; competition and fairness; and lowering risk in the system.
Derivatives markets are designed to provide a means for market users to offset price risks inherent in their businesses and to act as a public price discovery platform from which prices are broadly disseminated for public use. For derivatives markets to fulfill their role in the national and global economy, they must operate efficiently and fairly, and serve the needs of market users. The markets best fulfill this role when they are open, competitive and free from fraud, manipulation and other abuses such that the prices discovered on the markets reflect the forces of supply and demand.
The Commission strives to assure that Goal One is effectively met through the combined use of four oversight strategies: 1) the review of new contracts and rules and changes to contracts and rules; 2) continual surveillance of trading activity in the futures and swaps markets; 3) the review of regulated exchanges, DCMs and SEFs, to ensure that they are fulfilling their self-regulatory obligations; and, 4) the adoption of policies and strategies to promote market transparency.
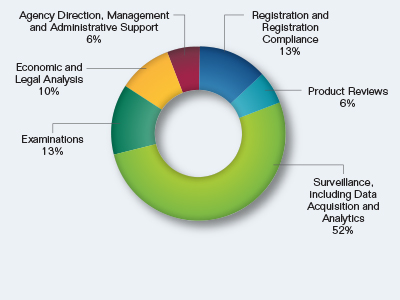
| Mission Activities | FY 2013 | FY 2014 | Change | |||
|---|---|---|---|---|---|---|
| Budget | FTE | Budget Request | FTE | Budget | FTE | |
| Registration and Registration Compliance | $17,640 | 69 | $11,430 | 42 | -$6,210 | -27 |
| Product Reviews | 7,520 | 30 | 5,720 | 22 | -1,800 | -8 |
| Surveillance, including Data Acquisition and Analytics | 47,670 | 143 | 45,550 | 123 | -2,120 | -20 |
| Examinations | 3,460 | 14 | 11,410 | 47 | 7,950 | 33 |
| Enforcement | 0 | 0 | 0 | 0 | 0 | 0 |
| Economic and Legal Analysis | 9,570 | 39 | 8,540 | 34 | -1,030 | -5 |
| International Policy Coordination | 0 | 0 | 0 | 0 | 0 | 0 |
| Data Infrastructure and Technology Support | 0 | 0 | 0 | 0 | 0 | 0 |
| Agency Direction, Management and Administrative Support | 5,160 | 22 | 5,010 | 21 | -150 | -1 |
| Total Goal One | $91,020 | 317 | $87,660 | 289 | -$3,360 | -28 |
Breakout of Goal One Request by Mission Activity
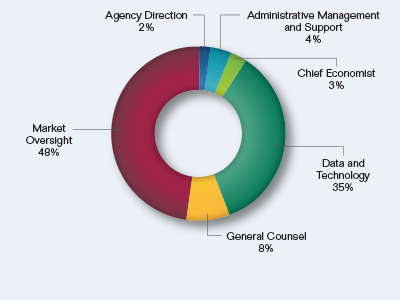
| FY 2013 | FY 2014 | Change | ||||
|---|---|---|---|---|---|---|
| Budget | FTE | Budget Request | FTE | Budget | FTE | |
| Agency Direction | $2,110 | 9 | $1,910 | 8 | -$200 | -1 |
| Administrative Management and Support | 3,050 | 13 | 3,100 | 13 | 50 | 0 |
| Chief Economist | 3,280 | 14 | 2,860 | 12 | -420 | -2 |
| Clearing and Risk | 0 | 0 | 0 | 0 | 0 | 0 |
| Data and Technology | 27,950 | 48 | 30,200 | 48 | 2,250 | 0 |
| Enforcement | 0 | 0 | 0 | 0 | 0 | 0 |
| General Counsel | 7,030 | 30 | 7,390 | 31 | 360 | 1 |
| International Affairs | 0 | 0 | 0 | 0 | 0 | 0 |
| Inspector General | 0 | 0 | 0 | 0 | 0 | 0 |
| Market Oversight | 47,600 | 203 | 42,200 | 177 | -5,400 | -26 |
| Swap Dealer and Intermediary Oversight | 0 | 0 | 0 | 0 | 0 | 0 |
| Total | $91,020 | 317 | $87,660 | 289 | -$3,360 | -28 |
Breakout of Goal One Request by Division