- Overview of the FY 2014 Budget & Performance Plan
- Summary of FY 2014 Budget Request by Mission Activity
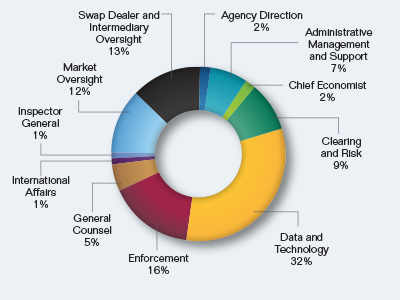
- Summary of FY 2014 Budget Request by Division
- Summary of FY 2014 Budget Request by Object Class
- Crosswalk from FY 2013 Budget to FY 2014 Request
- Crosswalk from FY 2013 Continuing Resolution to FY 2014 Request
- Statement of Availability on Basis of Obligations
- Statement of Availability on Basis of Appropriation by Program
- Mission Activities
- Divisions
Overview of the FY 2014 Budget & Performance Plan
Summary of FY 2014 Budget Request by Division
| FY 2012 EOY |
FY 2012 Actual |
FY 2013 Continuing Resolution |
FY 2013 Budget |
FY 2014 Request |
|||||
|---|---|---|---|---|---|---|---|---|---|
| Employment | FTE | Budget | FTE | Budget | FTE | Budget | FTE | Budget | |
| Agency Direction | 34 | 34 | $7,378 | 34 | $7,780 | 34 | $8,010 | 29 | $6,930 |
| Administrative Management and Support | 79 | 79 | 17,142 | 78 | 17,810 | 86 | 20,220 | 86 | 20,500 |
| Chief Economist | 17 | 13 | 3,689 | 18 | 4,100 | 29 | 6,820 | 25 | 5,960 |
| Clearing and Risk | 61 | 56 | 13,237 | 60 | 13,720 | 103 | 24,200 | 115 | 27,420 |
| Data and Technology | 85 | 83 | 64,958 | 85 | 64,420 | 122 | 98,670 | 122 | 102,080 |
| Enforcement | 166 | 168 | 36,020 | 165 | 37,710 | 214 | 50,240 | 215 | 51,260 |
| General Counsel | 53 | 52 | 11,501 | 55 | 12,560 | 69 | 15,750 | 69 | 16,450 |
| International Affairs | 10 | 10 | 2,170 | 10 | 2,280 | 16 | 3,760 | 17 | 4,050 |
| Inspector General | 5 | 4 | 1,085 | 5 | 1,140 | 6 | 1,410 | 6 | 1,430 |
| Market Oversight | 119 | 117 | 25,822 | 119 | 27,200 | 206 | 48,390 | 177 | 42,190 |
| Swap Dealer and Intermediary Oversight | 74 | 71 | 16,057 | 78 | 17,830 | 130 | 30,530 | 154 | 36,720 |
| Total | 703 | 687 | $199,059 | 707 | $206,550 | 1,015 | $308,000 | 1,015 | $315,000 |
$315 Million Budget Request by Division