CFTC Mission
To protect market users and the public from fraud, manipulation, abusive practices and systemic risk related to derivatives that are subject to the Commodity Exchange Act,
and to foster open, competitive, and financially sound markets.
A Message from
the Chairman
Each year the Commodity Futures Trading Commission (CFTC) tracks its performance against the goals included in the agency’s strategic plan. The current strategic plan was developed shortly after passage of the Dodd-Frank Wall Street Reform and Consumer Protection Act (Dodd-Frank Act), which expanded the CFTC’s responsibilities to include regulation and oversight of the swaps market. The goals were intended to serve as a benchmark for progress, to drive excellence, and promote greater efficiency. The results for Fiscal Year 2013 are documented in the following Annual Performance Report (APR).

Implementing the new financial framework has been a significant undertaking for our agency. The agency’s professional staff number 680 (on-board staff at the end of FY 2013). Yet, our staff has been flexible and dedicated in carrying out our new mandates. The progress they made on these necessary reforms is a credit to their tireless efforts. Significant rulemaking was completed. Consistent with Congress’s mandate, the CFTC acted to enable swap trading on regulated exchanges and clearing through central clearinghouses. The agency collected and began publishing swaps data reports. We have also continued to protect market integrity. Our enforcement team filed 82 actions in FY 2013, including several cases related to manipulation and false reporting of benchmark rates, resulting in substantial sanctions.
Notwithstanding our progress, the APR documents that goals in many areas were not met. Because of resource constraints, we did not meet performance targets for risk-based examinations of futures commission merchants, derivative clearing organizations and others. We will continue to do all we can with the resources we have. The limitations of our current budget, however, are evident. To fully achieve the benefit of financial reform and make sure that we are able to do all that we should be doing to discharge our responsibilities will require additional resources.
Most Americans do not participate directly in the derivatives markets. Yet these markets profoundly affect the prices we all pay for food, energy, and most other goods and services we buy each day. They enable farmers to lock in a price for their crops, utility companies or airlines to hedge the costs of fuel, and auto companies or soda bottlers to know what aluminum will cost. In normal times, these markets create substantial, but largely unseen, benefits for American families. During the financial crisis, however, they created just the opposite. It was during the financial crisis that many Americans first heard the word derivatives, when excessively risky over-the-counter swaps accelerated and intensified the crisis like gasoline poured on a fire. While we have taken many steps to address the causes of the financial crisis, we must never forget its terrible impact – the many jobs lost, homes foreclosed, businesses shuttered, and educations and retirements deferred.
This is why the work of the CFTC is so important. We must make sure that farmers, ranchers, manufacturers and other companies can continue to use these markets effectively to manage risk. And we must do all we can to make sure that the excessive risks related to derivatives that contributed to the financial crisis do not happen again.
Going forward, we will use the FY 2013 APR results to improve the CFTC’s ability to accomplish its mission. The information will also help us execute a new strategic plan that reflects the CFTC’s broadened responsibilities and progress to date. For example, with rulemaking largely completed, our focus is now shifting to fine-tuning the rules to address the needs of commercial end-users, implementing a robust compliance and enforcement program to maintain market integrity, prioritizing international coordination to support an open, competitive global marketplace, and establishing data standards and a comprehensive technology plan to support market oversight and transparency.
The CFTC is hard at work. The markets we oversee are stronger, more transparent, and more competitive as a result.
![]()
Timothy G. Massad
October 6, 2014
Overview
Overview presents key information regarding the CFTC FY 2013 Annual Performance Report. See below for details on the various sections.
-
Introduction
This document presents the Commodity Futures Trading Commission’s (CFTC) Annual Performance Report (APR) for Fiscal Year 2013. It is prepared in accordance with the requirements of the Government Performance and Results Act (GPRA) Modernization Act of 2010 (GPRAMA) and Office of Management and Budget (OMB) Circular A-11 Part 6. This report includes performance measure analysis and review of each of the five strategic goals and the tactical goal for Dodd-Frank Act rulemaking.
History
Congress established the CFTC as an independent agency in 1974, after its predecessor operated within the U.S. Department of Agriculture (USDA). Its mandate was renewed and/or expanded in 1978, 1982, 1986, 1992, 1995, 2000, 2008, and 2010. The CFTC and its predecessor agencies were established to protect market participants and the public from fraud, manipulation, and other abusive practices in the commodity futures and options markets. After the 2008 financial crises and the subsequent enactment of the Dodd-Frank Act, the CFTC’s mission expanded to include oversight of the swaps marketplace.
The Commission administers the Commodity Exchange Act (CEA), 7 U.S.C. section 1, et seq. The CEA brought under Federal regulation futures trading in all goods, articles, services, rights, and interests; commodity options trading; and leverage trading in gold and silver bullion and coins; and otherwise strengthened the regulation of the commodity futures trading industry. It established a comprehensive regulatory structure to oversee the volatile futures trading complex.
On July 21, 2010, President Obama signed the Dodd-Frank Act, which amended the CEA to establish a comprehensive new regulatory framework for swaps, as well as enhanced authorities over historically regulated entities. Title VII of the Dodd-Frank Act, which relates to swaps, was enacted to reduce systemic risk, increase transparency, and promote market integrity within the financial system.
The U.S. futures and swaps markets are estimated at $30 trillion and $400 trillion, respectively. By any measure, the markets under CFTC’s regulatory purview are large and economically significant. Given the enormity of these markets and the critical role they play in facilitating price discovery and hedging of risk, ensuring that these markets are transparent, open, and competitive is essential to their proper functioning and to help safeguard the financial stability of the Nation.
In February 2011, the Commission published a new strategic plan, CFTC FY 2011–2015 Strategic Plan (http://www.cftc.gov/reports/strategicplan/2015/index.htm), integrating the expanded responsibilities under the Dodd-Frank Act with its existing mission and goals. The regulation of swaps has been incorporated into the regulatory structure that has existed for futures and options markets. The CFTC has been working to write the rules Congress mandated to regulate the swaps markets, implement those rules, test and adjust those rules, and write new rules as necessary to bring effective regulation to all derivatives markets over the five-year period.
The focused rule-writing effort to complete the remaining 8 rules required by the Dodd-Frank Act remains a tactical goal that has an objective, strategy, and performance measure associated with it. Developing and implementing the Dodd-Frank Act rules is one of the most important and difficult efforts the Commission has ever undertaken. The Dodd-Frank Act set a timeframe of 360 days (or less in a few instances) for completion of the rules, but the Commission was unable to comply with this for several reasons:
- Commission’s continued budget constraints;
- Commitment to significant and open interaction with Congress; market participants; the public; and other regulators, both domestic and international; and
- Expanded rule complexity.
The comment and consideration aspects of the rulemaking process take an enormous amount of time. The Commission has and will continue to ensure all appropriate thought is given to rule development.
The Commission is committed to transparency in the rulemaking process. As such, the Commission maintains a list of all of its meetings relating to the implementation of the Dodd-Frank Act, as well as the participants, issues discussed, and all materials provided to the Commission, on its website at http://www.cftc.gov/LawRegulation/DoddFrankAct/ExternalMeetings/index.htm.
-
About This Report
The FY 2013 APR provides an overview of the CFTC’s performance results relative to its mission in order to help Congress, the President, and the public assess the CFTC’s stewardship over the financial resources entrusted to it. The report is organized by strategic goal and performance measure, and provides detail on how each contributes to the Commission’s overall mission. The report provides information about the Commission’s performance as an organization, its achievements, and its challenges.
The FY 2013 APR meets a variety of reporting requirements stemming from numerous laws focusing on improved accountability among Federal agencies and guidance described in Office of Management and Budget (OMB) Circulars A-11 and A-136.
Suggestions for improving this document can be sent to the following address:
Commodity Futures Trading Commission
Business Management and Planning Branch
Three Lafayette Centre
1155 21st Street, NW
Washington, DC 20581The Commission’s annual reporting includes the following three components:
Agency Financial Report (AFR)
Available December 2013. A report on the Commission end of year financial position that includes, but is not limited to, financial statements, notes to the financial statements, and a report of the independent auditors.
Annual Performance Report (APR)
Available February 2014. The APR is a report on Commission performance that is available to Congress with the Congressional Budget Justification in February. The APR contains information on the CFTC’s progress to achieve goals during the previous year.
Summary of Performance and
Financial Information (SPFI)Available March 2014. This document provides an integrated overview of performance and financial information that integrates significant aspects of the AFR and the APR into a user-friendly consolidated format.
When complete, these reports are available on the Commission’s website at http://www.cftc.gov/About/CFTCReports/index.htm.
-
The Organization
-
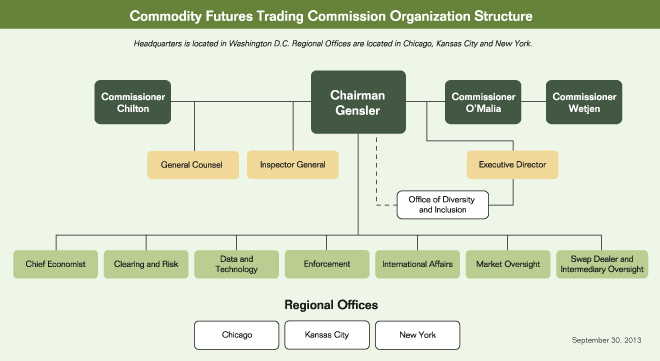
CFTC Organizational Programs
Below are brief descriptions of the organizational programs within the CFTC.
The Commission
The Offices of the Chairman and the Commissioners provide executive direction and leadership to the Commission. The Offices of the Chairman include Public Affairs and Legislative Affairs.
Division of Clearing and Risk (DCR)
The DCR program oversees Derivatives Clearing Organizations (DCOs) and other market participants that may pose risk to the clearing process, including Swap Dealers (SDs), Major Swap Participants (MSPs), Futures Commission Merchants (FCMs), and large traders; and the clearing of futures, options on futures, and swaps by DCOs. The DCR staff prepare proposed regulations, orders, guidelines, and other regulatory work products on issues pertaining to DCOs; review DCO applications and rule submissions, and make recommendations to the Commission; make determinations and recommendations to the Commission to which types of swaps should be cleared; make determinations and recommendations to the Commission as to the initial eligibility or continuing qualification of a DCO to clear swaps; assess compliance by DCOs with the CEA and Commission regulations, including examining systemically important DCOs (SIDCOs) at least once a year; and conduct risk assessment and financial surveillance through the use of risk assessment tools, including automated systems to gather and analyze financial information to identify, quantify, and monitor the risks posed by DCOs, clearing members, and market participants and their financial impact.
Division of Enforcement (DOE)
The DOE program investigates and prosecutes alleged violations of the CEA and Commission regulations. For example, the Division brings enforcement actions against individuals and firms who violate these laws in connection with their trading commodity futures and options, and swaps, on designated domestic exchanges and other registered entities; those who improperly market futures and options contracts to retail investors or perpetrate Ponzi schemes; those who use manipulative or deceptive schemes in connection with commodities, futures or swaps; and those who engage in disruptive trading practices. The DOE also includes the Whistleblower Office.
Division of Market Oversight (DMO)
The DMO program fosters markets that accurately reflect the forces of supply and demand for the underlying commodities and are free of disruptive activity. To achieve this goal, program staff oversees trade execution facilities, perform market and trade practice surveillance, review new exchange applications, and examine existing exchanges to determine their compliance with the applicable core principles. Other important work includes evaluating new products to make certain that they are not susceptible to manipulation, and reviewing exchange rules and actions to ensure compliance with the CEA and CFTC regulations.
Division of Swap Dealer and Intermediary Oversight (DSIO)
The DSIO program oversees the registration and compliance activities of intermediaries and the futures industry Self-Regulatory Organizations, which include the U.S. derivatives exchanges and the National Futures Association (NFA). Program staff develop regulations concerning registration, fitness, financial adequacy, sales practices, protection of customer funds, cross-border transactions, and anti-money laundering programs, as well as policies for coordination with international market authorities and emergency procedures to address market-related events that impact intermediaries. With the passage of the Dodd-Frank Act, DSIO also is responsible for the development of, or monitoring for compliance with, regulations addressing registration requirements, business conduct standards, capital adequacy, and margin requirements for Security Deposits and Major Swap Participants.
Office of the Chief Economist (OCE)
The OCE provides economic analysis, advice, and context to the Commission. OCE staff provides rigorous economic and statistical analyses of both current issues and topics of long-term interest. For example, the OCE plays an integral role in the implementation of new financial market regulations by providing economic expertise and cost benefit considerations underlying these regulations. OCE staff conducts high quality; long-term research projects that help achieve the CFTC’s mission. OCE staff also collaborates with economists and other staff in Divisions and Offices across the Commission in order to exploit synergies with OCE research and expertise.
Office of Data and Technology (ODT)
The ODT provides technology and data management support for Commission market and financial oversight, surveillance, enforcement, legal support, and public transparency activities. The Commission’s over-arching information technology (IT) strategy is to increase the integration of IT into the Commission’s operating model. That strategy is followed by giving priority to services that provide the greatest mission benefit; architecting services using small components that can be assembled and reassembled with agility; and delivering solutions in short, iterative phases. ODT ensures that data is managed as an enterprise asset and aggressively promotes and adopts industry data standards. ODT also provides secure and stable network, communication, storage, computing, and information management infrastructure and services.
Office of the General Counsel (OGC)
The OGC provides legal services and support to the Commission and all of its programs. These services include: 1) engaging in defensive, appellate, and amicus curiae litigation; 2) assisting the Commission in the performance of its adjudicatory functions; 3) providing legal advice and support for Commission programs; 4) drafting and assisting other program areas in preparing Commission regulations; 5) interpreting the CEA; and 6) providing advice on legislative and regulatory issues.
Office of International Affairs (OIA)
The OIA advises the Commission regarding international regulatory initiatives; provides guidance regarding international issues raised in Commission matters; represents the Commission in international organizations, such as the International Organization of Securities Commissions (IOSCO); coordinates Commission policy as it relates to policies and initiatives of major international jurisdictions, the G-20, the Financial Stability Board, and the U.S. Treasury Department; and provides technical assistance to international market authorities.
Office of the Inspector General (OIG)
The OIG is an independent organizational unit at the CFTC. The mission of the OIG is to detect waste, fraud, and abuse and to promote integrity, economy, efficiency, and effectiveness in the CFTC’s programs and operations. As such it has the ability to review all of the Commission’s programs, activities, and records. In accordance with the Inspector General Act of 1978, as amended, the OIG issues semiannual reports detailing its activities, findings, and recommendations.
Office of the Executive Director (OED)
The Commission’s ability to achieve its mission of protecting the public, derivative market participants, U.S. economy, and the U.S. position in global markets is driven by well-informed and reasoned executive direction; strong and focused management; and an efficiently-resourced, dedicated, and productive workforce. These attributes of an effective organization combine to lead and support the critical work of the Commission to provide sound regulatory oversight and enforcement programs for the U.S. public. The Executive Director ensures the Commission’s continued success, continuity of operations, and adaptation to the ever-changing markets it is charged with regulating; directs the effective and efficient allocation of CFTC resources; develops and implements management and administrative policy; and ensures program performance is measured and tracked Commission-wide. The OED includes the following programs: Business Management and Planning, Executive Secretariat, Financial Management, Human Resources, Diversity and Inclusion, Consumer Outreach, and the Office of Proceedings. The Office of Proceedings has a dual function 1) to provide an inexpensive, impartial, and expeditious forum for handling customer complaints against persons or firms registered under the CEA and 2) to administer enforcement actions, including statutory disqualifications, and wage garnishment cases.
-
Strategic Framework
The following table is an overview of the Commission’s mission statement, strategic goals and objectives under the FY 2011–2015 strategic framework:
Mission Statement
To protect market users and the public from fraud, manipulation, abusive practices and systemic risk related to derivatives that are subject to the Commodity Exchange Act, and to foster open, competitive, and financially sound markets.Strategic Goal One
Protect the public and market participants by ensuring market integrity, promoting transparency,
competition and fairness and lowering risk in the system.Objectives - Ensure that markets are structured to reflect the forces of supply and demand for the underlying commodity and are free from manipulation, disruptive activity and abusive trading practices.
- Ensure that U.S. DCMs and SEFs have the systems, procedures and resources necessary for effective self-regulation and ongoing compliance with core principles.
- Promote transparency by producing and publishing summary market statistics for the futures, options and swaps markets.
Strategic Goal Two
Protect the public and market participants by ensuring the financial integrity of derivatives transactions,
mitigation of systemic risk, and the fitness and soundness of intermediaries and other registrants.Objectives - Clearing organizations and firms participating in the derivatives industry are financially sound.
- Registered intermediaries meet standards for fitness and conduct.
- Ensure that self-regulatory organizations fulfill their financial surveillance responsibilities.
- Ensure that information technology systems support the Commission’s existing and expanded responsibilities to ensure financially sound markets, mitigate systemic risk, and monitor intermediaries
Strategic Goal Three
Protect the public and market participants through a robust enforcement program.
Objectives - Identify and stop violations of the Commodity Exchange Act and Regulations; deter others from engaging in future misconduct.
- Increase cooperative enforcement.
Strategic Goal Four
Enhance integrity of U.S. markets by engaging in cross-border cooperation, promoting strong international regulatory standards, and encouraging ongoing convergence of laws and regulation worldwide.
Objectives - Cooperate and coordinate with domestic and foreign regulatory authorities.
- Promote high levels of internationally accepted standards of best practice.
- Provide global technical assistance.
Strategic Goal Five
Promote Commission excellence through executive direction and leadership, organizational and
individual performance management, and effective management of resources.Objectives - An organizational structure that is aligned and streamlined to operate and carry out its mission efficiently and effectively.
- Effectively respond to a the regulatory needs of a dynamic and complex derivatives market place and efficiently allocate limited resources to the highest priority activities
- Attract, engage, develop and retain an exceptionally qualified, diverse, and productive workforce.
- Information technology (IT) supports and enhances mission accomplishment through effective and efficient infrastructure, systems and services.
- Ensure effective stewardship and management of CFTC financial resources.
-
Summary of Performance
The following sections include a high-level discussion of each of the five strategic goals and the tactical goals for Dodd-Frank Act rulemaking, as well as a detailed analysis and review of each performance measure (shortfalls and successes). The accomplishments demonstrate progress made in FY 2013 toward the achievement of the Commission’s mission and strategic goals. However, in many areas, progress was limited by resource constraints and reallocations in an attempt to maintain progress toward writing and implementing the new rules required under the Dodd-Frank Act. The Commission’s regulatory purview has expanded in scope, scale and complexity with the passage of Dodd-Frank and the increased use of technology in the markets in the last five years. However, the Commission was not provided with the commensurate increase in budget authority to oversee the markets and market participants over that period of time. These constraints, which were exacerbated by the FY 2013 budget sequestration, have limited the effectiveness of the Commission in carrying out its mission.
In FY 2014, the Commission will begin monitoring and analyzing strategic objectives outlined in the new Strategic Plan which spans FY 2014 to FY 2018. This new Strategic Plan will have a different set of performance goals across the Commission, many of which are new goals. The CFTC plans to monitor these goals on a quarterly basis, provide better and more frequent assessments to leadership, and provide division and office directors more time to make adjustments where warranted.
Some performance measures described in the current FY 2011 to FY 2015 Strategic Plan are dependent upon the completion of specific rules. As a result, two of the 54 performance measures were considered “Not Applicable” during the FY 2013 reporting period. An additional four measures were also categorized as “Not Applicable,” either remaining in development from the onset of the Strategic Plan, newly implemented, or lacking activity to report.
The following identifies the specific performance measures considered “Not Applicable:”
- 1.1.1.1 Implement automated position limit alerts for futures, option, and swaps markets.
- 1.1.2.1 Review information requirements of current and proposed forms.
- 1.1.3.1 Transmit information and consult with the Office of Information Technology Services (OITS) [Now recognized as the Office of Data and Technology—ODT] to implement electronic filing of forms. Fully deploy electronic filing of trader reporting forms. Percent complete.
- 2.2.1.1 Conduct direct examinations of SDs and MSPs, identify deficiencies and confirm that all deficiencies identified are corrected within specified period of time.
- 3.1.1.2 The CFTC will bring claims in due recognition of the broadened enforcement mandate provided by the Dodd-Frank Act, and will seek proportionate remedies, including civil monetary penalties, undertakings and restitution, that have the highest impact on and greatest deterrent effect against potential future violations.
- 4.1.1.2 Regular issuance of outgoing international requests for enforcement assistance and referrals made by the CFTC to foreign regulators pertaining to matters involving their jurisdictions.
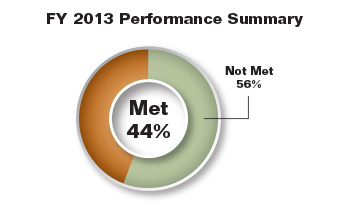
The performance measures in this report are rated as: Met, or Not Met. Overall results for the Commission’s performance measures are depicted in the following table:
CFTC Performance Results # of Measures1 Met Not Met All Goals 48 21 27 % of Total 44% 56% 1 Excludes six performance measures categorized as “Not Applicable” for FY 2013. (back to text) -
Looking Ahead
Approaching the mid-year point of FY 2014, the CFTC has largely moved beyond rule writing and initial compliance dates and is focused on reviewing entities and registrants as to whether they fully come into compliance. As the Commission has done for many years, we are doing this through examinations, surveillance, enforcement and issuing guidance and advisories. To smooth implementation, CFTC will continue to work with market participants as needed.
A new Strategic Plan spanning FY 2014 to FY 2018 will be introduced starting in the next FY 2014 performance cycle. The new Strategic Plan will monitor a new set of performance goals. In FY 2014 and FY 2015, these will be base-lined with targets established in the Annual Performance Plan. The CFTC plans to monitor these goals on a quarterly basis, provide better and more frequent assessments to leadership, and provide division and office directors more time to make adjustments where warranted.
The CFTC will seek greater accountability by developing annual operational plans. These operational plans tie the strategic goals and objectives with tactical requirements and will be approved by the Commission annually. The goals, objectives, and strategies will also be included in the annual performance evaluations of the office or division director or particular staff charged with implementing the goals, objectives, and strategies.
In November, the President made note of the progress the CFTC has made during his nomination of the next Chairman of the CFTC, “Our markets have hit record highs and there’s no doubt our financial system is more stable. And a big reason for that stability is the work of a small but mighty independent agency: the Commodity Futures Trading Commission.”2 With the expansion of the scale and scope of the Commission’s responsibilities as it moves from the rulewriting phase of Dodd-Frank to the industry oversight phase, the CFTC looks forward to welcoming a new Chairman in 2014, and for continued work towards implementation of the Dodd-Frank Act and the agency’s mission.
2 President Barack Obama, “Remarks by the President Nominating Timothy Massad to Lead the CFTC,”The Whitehouse State Dining Room, Washington, DC (November 12, 2013). (back to text)
Performance Analysis
and Review
The Performance Analysis and Review presents an overview as well as details for Objective 0.1 and the five Strategic Goals. See below for information on each goal including introduction, performance measures, performance results, and performance analysis and review.
-
-
Overview
The remaining portion of this report details the Commission’s efforts to meet its rulemaking objectives, strategic goals, and performance targets as described in the Strategic Plan. Each strategic goal is summarized with highlevel achievements before leading into a detailed performance analysis and review narrative for each associated measure. For reference purposes, each performance measure is uniquely identified using the following hierarchical structure:
Strategic Goal.Objective.Strategy.Performance Measure (e.g., 1.1.1.1)
Appendix B, “CFTC Performance Measures and Results,” provides a summary of performance measure information in table format for FY 2011 and 2012 Actual, FY 2013 Planned, Actual and future year performance targets. Performance measures which were rule-dependent (Dodd-Frank Act) and/or others considered “Not Applicable” during FY 2013 have been placed at the bottom of the table in a section titled “Performance Measures Considered Not Applicable in FY 2013.”
-
Objective 0.1—Complete all Dodd-Frank Act rule development requirements within the statutory deadlines.
Implementing the new responsibilities given the CFTC by the Dodd-Frank Act remained a significant priority and critical focus of the Commission during the third year of this Strategic Plan. Congress required the Commission to complete approximately 60 rules within 360 days; some having deadlines of 90, 180, or 270 days. The workload associated with the rulemaking process, together with studies, comment review, and other actions to be taken, is unprecedented for the CFTC.
The CFTC began working on the draft rules that Congress assigned to it in July 2010. The Commission first identified 30 areas of rulemaking to implement the Dodd-Frank Act (Appendix C in the Strategic Plan lists the 30 areas – see http://www.cftc.gov/reports/strategicplan/2015/2015strategicplanapp03.html). While some areas only required one rule, others required multiple rules. Teams were assigned to each rule grouping. Where proposed and interim final rules have been issued, the Commission is affording as much opportunity as practicable for public comment both through written submissions and public meetings. The Commission has and will fully consider the comments and continue to offer this opportunity as the proposed rules are developed. The CFTC has and will continue to work with the SEC and other regulators to maximize consistency and minimize overlap or duplication. All information will be considered in developing the best possible final rule.
PERFORMANCE MEASURE 0.1.1.1 Complete all Dodd-Frank Act rules within statutory time frames. Percentage of rules complete.
FY 2013 Target: 100%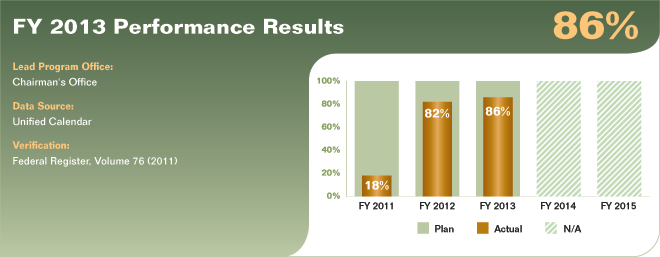
Performance Analysis & Review
The performance target was not met for FY 2013. The Dodd-Frank Act set a timeframe of 360 days (or less in a few instances) for completion of the rules. The Commission has been unable to accomplish this for several reasons. Primarily, the continued delay is a matter of capacity for rule consideration. With all rules, the CFTC has taken, and will continue to take, a thoughtful and balanced approach. The Commission actively seeks and takes into full consideration public comments regarding the costs, benefits, and economic effects of proposed rules. Given the significance of the rules and consequent public interest, it has taken substantial time and resources to accomplish this. Several other variables contributed to the delay.
- Due to funding constraints, the Commission was unable to acquire sufficient staff resources to ensure the completion of this objective on time;
- To ensure development and implementation of rules that are well balanced between risk mitigation and cost to the industry and public, additional meetings and opportunities for public input with Congress, industry, and the public were necessary and appropriate; and
- While some rules are fairly straight forward, many are intricate and raise interrelated and complex issues. Staff members require the appropriate time to analyze, summarize, and consider the additional public input that has been sought, and develop draft final rules for deliberation by the Commission.
Despite the above limitations placed on the Commission since the onset of the massive undertaking, it was able to accomplish the following Dodd-Frank Act related rulemaking tasks through September 30, 2013:
- Issued 74 proposed rules and issued 64 final rules;
- Received, reviewed, and analyzed approximately 28,000 comments; and
- Held 14 technical conferences / roundtables.
The CFTC took the following significant steps toward the completion of the Dodd-Frank Act rule requirements during FY 2013:
- Issued 3 proposed rules and orders, as well as 22 final rules.
Remaining rules to be finalized by the Commission as mandated by the Dodd-Frank Act are as follows:
- Capital Requirements of Swap Dealers and Major Swap Participants (76 FR 27802);
- Margin Requirements for Uncleared Swaps for Swap Dealers and Major Swap Participants (76 FR 23732);
- Treatment of Securities in a Portfolio Margining Account in a Commodity Broker Bankruptcy (75 FR 75432), Completed after FY 2013 close (November 6, 2013);
- Governance Requirements for Derivatives Clearing Organizations, Designated Contract Markets, and Swap Execution Facilities; Additional Requirements Regarding the Mitigation of Conflicts of Interest (76 FR 722);
- Requirements for Derivatives Clearing Organizations, Designated Contract Markets, and Swap Execution Facilities Regarding the Mitigation of Conflicts of Interest (75 FR 63732);
- Position Limits for Futures and Swaps (76 FR 71626)3;
- Prohibitions and Restrictions on Proprietary Trading and Certain Interests in, and Relationships With, Hedge Funds and Covered Funds (77 FR 8332), Completed after FY 2013 close (December 10, 2013); and
- Stress Testing (§ 165(i); this rule has not been proposed).
3 Vacated by U.S. District Court for the District of Columbia, Sept 28, 2012. (back to text)
-
-
-
Goal One—Protect the public and market participants by ensuring market integrity, promoting transparency, competition and fairness and lowering risk in the system.
Derivatives markets are designed to provide a means for market users to offset price risks inherent in their businesses and to act as a public price discovery platform from which prices are broadly disseminated for public use. For derivatives markets to fulfill their role in the national and global economy, they must operate efficiently and fairly, and serve the needs of market users. The markets best fulfill this role when they are open, competitive, and free from fraud, manipulation, and other abuses such that the prices discovered on the markets reflect the forces of supply and demand.
The Commission strives to assure that Goal One is effectively met through the combined use of four oversight strategies: 1) review of new contracts and rules, and amendments to existing contracts and rules; 2) surveillance of trading activity in the futures and swaps markets; 3) review of regulated exchanges, designated contract markets (DCMs), Swap Execution Facilities (SEFs) and swap data repositories (SDRs) to verify whether they are fulfilling their self-regulatory obligations; and 4) adoption of policies and strategies to promote market transparency.
Accomplishments related to progress in achieving this goal include:
- The CFTC completed and began implementing the rules providing registration and operation requirements for SEFs that became effective on May 16, 2013 and provisionally registered 17 SEFs by September 30, 2013.
- The Commission completed the “Made Available to Trade” rulemaking, effective on May 16, 2013, that allows a DCM or SEF to subject a swap that it determines is “available to trade” to the trade execution requirement.
- With respect to non-System Safeguard Examinations, completed Rule Enforcement Reviews (RERs) of three major DCMs (ICE Futures U.S. and a combined CME/CBT RER) during FY 2013 and RERs of three non-major exchanges; ELX Futures, Minneapolis Grain Exchange (MGEX), and Chicago Board Options Exchange (CBOE) Futures.
- Completed reviews of 57 new product certifications, nine exempt market filings, 317 rule filings, and one Foreign Board of Trade (FBOT) no-action request.
- Drafted two significant IOSCO reports: the Report on Over-the-Counter (OTC) Derivatives Data Reporting and Aggregation Requirements, and the Report on Trading of OTC Derivatives.
- Created three new automated alerts and three new reports, and enhanced four trade practice alerts, providing for a more efficient and effective market and trade surveillance program.
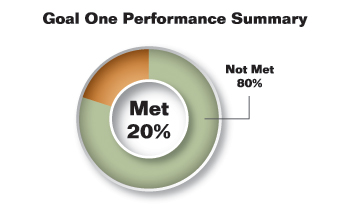
Goal One performance measure results are depicted in the following table:
Goal One Performance Results # of Measures4 Met Not Met Goal One 10 2 8 % of Total 20% 80% 4 Excludes two performance measures categorized as “Not Applicable” for FY 2013. (back to text) -
Goal One performance measures, analysis and review – Objective 1.1
PERFORMANCE MEASURE 1.1.1.2 Implement automated surveillance alerts and a case
management system.
FY 2013 Target: 100%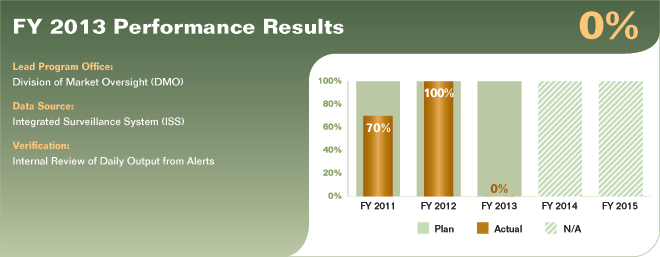
Performance Analysis & Review
The performance target was not met for FY 2013. In FY 2012 the Commission focused its efforts on creating detection systems for futures, and the Commission indicated in the FY 2012 Annual Performance Report that future progress was expected to be extremely curtailed due to resource constraints. The target for FY 2013 became more difficult to achieve due to the numerous data inconsistences in reported swaps. Troubleshooting these inconsistencies through a manual process was not supportable on an ongoing basis.
With clean data, additional resources will be required to create automated surveillance tools including alerts for the swaps market. Some trading instruments, such as the Credit Default Swap Index (CDS) and Interest Rate Swap (IRS) cannot support automated surveillance except in the most rudimentary ways. Exotic or Bespoke swaps do not readily lend themselves to automated surveillance. Automated surveillance on other asset-class swaps is also difficult but progress is expected. The addition of integration into futures data sources presents other challenges.
Usable swaps data and additional staff are necessary for the creation of automated alerts. The Commission is working to collect clean data suitable for automated surveillance.
PERFORMANCE MEASURE 1.1.1.3 Implement automated trading violation alerts and a case management system.
FY 2013 Target: Implement four automated trading violation alerts.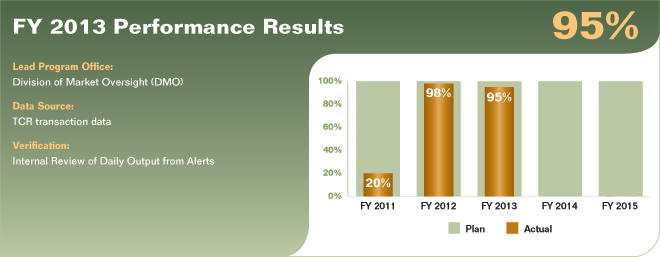
Performance Analysis & Review
The performance target was not met for FY 2013. Surveillance staff created three automated trading violation alerts for pre-arranged trades, block trades and wash trades, which were combined to become one alert. Staff began working on an Exchange of Futures for Related Product (EFRP) In & Out Engine that was completed in October of 2013. Automating these trading violation alerts increases efficiency and frees up resources to be moved to other surveillance activities.
Work on the final violation alert began during FY 2013 and was completed shortly after the end of the government shutdown. CFTC did not have adequate resources to meet 100% of this measure; however, there are other detection engines in place that will be able to detect trading violations and abuses in the marketplace. These automated alerts will provide efficient detection of potential violations.
PERFORMANCE MEASURE 1.1.4.1 Percentage of contracts that are reviewed, in a timely manner, following a finding of market significance, and determined to be in compliance with core principles
or referred back to exchange for modification.
FY 2013 Target: 100%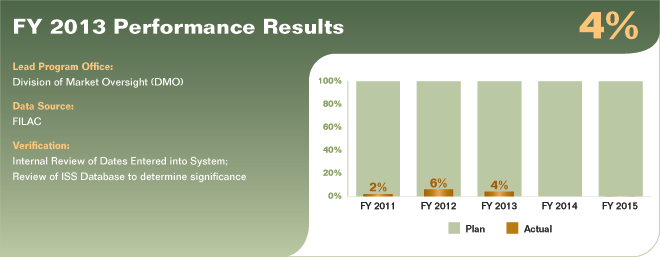
Performance Analysis & Review
The performance target was not met for FY 2013. The Commission reviews a contract’s terms and conditions, and the position limits and accountability standards, to ensure that a contract is not readily susceptible to manipulation and that the position limits or accountability standards are appropriate. Often, a review includes an analysis of the exchange’s assumptions regarding supply and demand of the underlying commodity as well as a survey of prevailing cash market practice. In the absence of Commission due diligence, undetected contract flaws or faulty assumptions, could make contracts susceptible to manipulation, cause disruptions in the cash market, or encourage excessive speculation.
Of the 200 contracts that met the volume and open interest thresholds indicating market significance, seven were reviewed by Division staff within 90 days and found to be in compliance with core principles. It should be noted, however, that the Commission completed or terminated reviews of a total of 1,527 contract filings. Commission terminations resulted from contract de-listings. Of the rest, the vast majority were reviews of nearly 1,450 security futures products.
The Commission does not expect to meet the target in future years. In this regard, there currently are about 180 contracts that currently have met the market significance thresholds, but over 90 days have elapsed since meeting those thresholds. In addition, there are over 3,000 additional contracts awaiting review for compliance with core principles. Moreover, with new SEF registrations and expected SEF registrations, the backlog of product filings will increase dramatically. Although staff that review contract certification filings are being released from rulemakings and other projects related to implementation of the Dodd-Frank Act, the size of that staff is too small to expect the target to be met.
If contracts that may be readily susceptible to manipulation or that are subject to inappropriate position limits are listed for trading, this could cause distortions in the prices of the underlying and related commodities and adversely affect hedging by commercial entities.
PERFORMANCE MEASURE 1.1.5.1 Rule submissions are reviewed and a determination is made regarding compliance with the CEA, or referred back to the exchange for correction, as amended by the Dodd-Frank Act and Commission regulations within the required 10-day or 90-day time period.
FY 2013 Target: 100%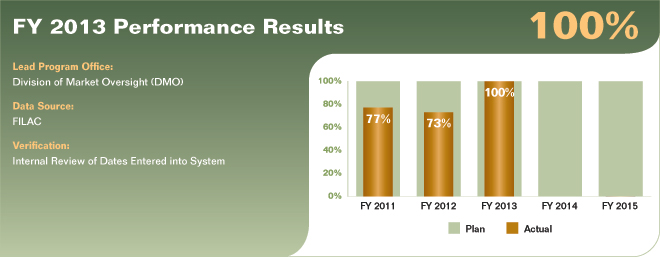
Performance Analysis & Review
The performance target was met for FY 2013. The Commission received during the fiscal year 690 separate rule submissions (most containing more than one new or revised rule and many containing a large number of individual rules or consisting of elements other than a rule from the rulebook) pursuant to Regulations 40.6 (self-certified) or 40.5 (approval requested). All of the submissions received in FY 2013 were successfully processed during the statutory timeframe. All rule submissions are entered into the Filings and Actions database. At that time, a staff economist conducts a cursory review of the filing to identify any obvious issues or violations of the Commodity Exchange Act, Commission regulations, or Commission polices. If no issues or violations are found, the amendment may be implemented after 10 business days. A more formal documented review may follow; however, the formal review typically does not occur within the 10-day time period. No product rule amendment filings were stayed.
By Meeting this target, the Commission notes that exchange rules do not conflict with public policy goals. For products, this means that rule amendments do not cause contracts to become readily susceptible to manipulation or to be subject to inappropriate position limits or position accountability and that product rule amendments do not affect the value of existing positions.
PERFORMANCE MEASURE 1.1.6.1 DCM and SEF applications are reviewed and a determination
is made regarding compliance with core principles within statutory time frames.
FY 2013 Target: 100%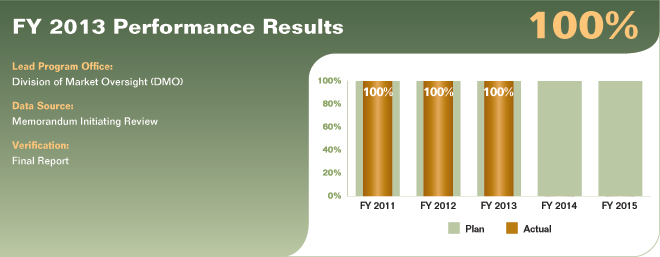
Performance Analysis & Review
The performance target was met for FY 2013. The Commission received 22 applications for temporary registration as SEFs and two applications for designation as DCMs. Eighteen of the SEF applicants were temporarily registered; two of them withdrew their applications; and two of the SEF applications are pending as they were received towards the end of the fiscal year. One of the DCM applications was designated during the fiscal year and the time period for review of the other DCM application was stayed as of the end of the fiscal year. There are two SEF applications for temporary registration pending that were submitted just prior to the close of the fiscal year. The application materials submitted were deemed insufficient and were inadequate to complete the temporary registration process.
-
Goal One performance measures, analysis and review – Objective 1.2
PERFORMANCE MEASURE 1.2.1.1 Percentage of major DCMs and SEFs reviewed, during the year. (Structural Sufficiency)
FY 2013 Target: 100%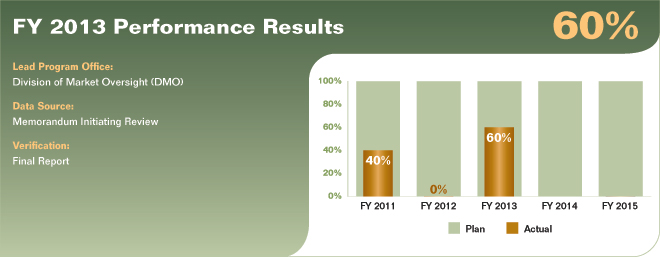
Performance Analysis & Review
The performance target was not met for FY 2013. During this performance cycle, the CFTC completed rule enforcement reviews (RERs) for three major DCMs: ICE Futures U.S., CME and CBT. Due to the increased responsibility of SDR and SEF registration in FY 2013 the Commission’s resources limited what could be completed.
The Commission continues to face the challenges of prioritizing rulemaking, SDR registration, SEF registration, and DCM oversight. Functions outside those activities, including the review of major DCMs, was extremely limited during the fiscal year.
The RER program has been modified so that each examination will, on average, address a more focused set of DCM sprogram areas (e.g., market surveillance, trade practice surveillance, audit trail, disciplinary, etc.). In this manner, the Commission will attempt to maintain an RER presence at DCMs while working within its resources and competing demands.
PERFORMANCE MEASURE 1.2.1.2 Percentage of non-major DCMs and SEFs reviewed, during the year. (Structural Sufficiency)
FY 2013 Target: 100%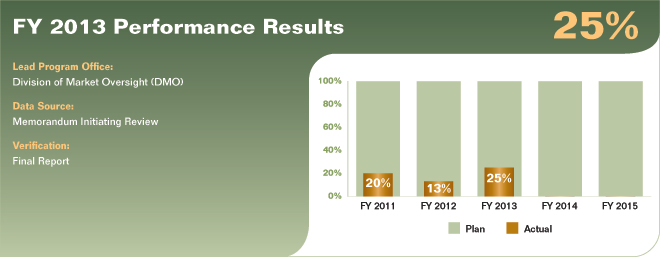
Performance Analysis & Review
The performance target was not met for FY 2013. During this performance cycle, the CFTC completed rule enforcement reviews (RERs) for three non-major designated contract markets (DCMs): ELX Futures, L.P. (ELX), the Minneapolis Grain Exchange (MGEX), and the Chicago Board Options Exchange (CBOE). Due to the increased responsibility of SDR and SEF registration in FY 2013, CFTC’s resources were limited with what they could complete. North American Derivatives Exchange (NADEX) and OneChicago, LLC (OneChicago) was completed in 1st quarter FY 2014.
Due to the priority placed on rulemaking, SDR registration, and the temporary registration of SEFs, functions outside those activities, including the review of non-major DCMs, was extremely limited during the fiscal year. With the introduction of SEFs, challenges in meeting this goal will continue.
PERFORMANCE MEASURE 1.2.2.1 Percentage of major DCMs and SEFs reviewed, during the year. (Automated Systems and Business Continuity)
FY 2013 Target: 100%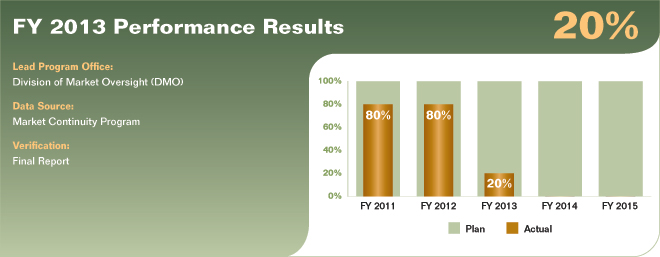
Performance Analysis & Review
The performance target was not met for FY 2013. CFTC completed one major (Tier One) DCM review for ICE Futures U.S. CFTC also completed the systems safeguard examinations (SSE) of CME Group, which includes four DCMs (CME, CBOT, NYMEX, and COMEX), but the report is still in seriatim for acceptance by the Commission due to the government shutdown.
The Commission’s Market Continuity program conducts the targeted level of SSEs for DCMs and now SDRs and SEFs. Additionally, staff has to participate in DCM, SEF and SDR application designation and reviews. Meeting this target will continue to pose challenges.
Regular SSEs are essential to effective market oversight, because the automated systems and business continuity and disaster recovery plans and resources of DCMs, SDRs, and SEFs play a central and critical role in today’s predominantly electronic swaps and futures trading environment.
PERFORMANCE MEASURE 1.2.2.2 Percentage of non-major DCMs and SEFs reviewed, during the year. (Automated Systems and Business Continuity)
FY 2013 Target: 33%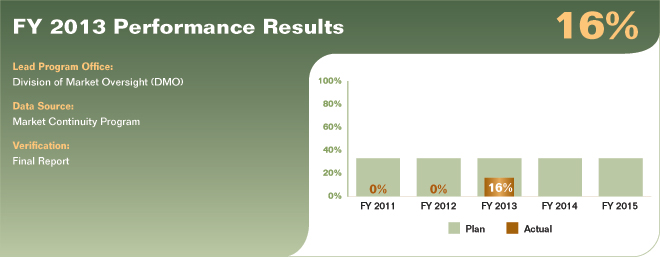
Performance Analysis & Review
The performance target was not met for FY 2013. During the second quarter of FY 2013, the final examinations report of two non-major DCMs, ELX Futures, L.P. and NYSE Liffe were completed. The Commission’s Market Continuity program conducts the targeted level of SSEs for DCMs and now SDRs and SEFs. Additionally, staff participates in DCM, SEF and SDR application designation and reviews. Meeting this target will continue to pose challenges.
Regular SSEs are essential to effective market oversight, because the automated systems and business continuity and disaster recovery plans and resources of DCMs and SEFs play a central and critical role in today’s predominantly electronic swaps and futures trading environment. The Commission differentiates between major and non-major DCMs/SEFs according to their potential for creating systemic risk in the event of failure.
-
Goal One performance measures, analysis and review – Objective 1.3
PERFORMANCE MEASURE 1.3.1.1 Publish reports for swaps markets activity.
FY 2013 Target: Develop and test aggregation methods to group all commodity swap products under CFTC position limits. Publish swaps market report for interest rate swap products. Publish Dodd-Frank Act required seminanual and annual swaps reports for all interest rate swap products.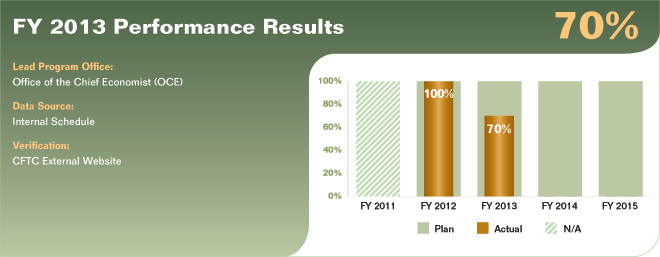
Performance Analysis & Review
The performance target was not met for FY 2013. The CFTC launched the Weekly Swaps Report on November 20, 2013. The report provides the general public information about the swaps marketplace that was hidden and opaque before the Dodd-Frank Act. The report provides detailed information on the interest rate and credit asset classes, which comprise roughly 90% of the approximately $400 trillion market-facing swaps market. Estimates are presented at the aggregate level for equity, foreign exchange, and commodities asset classes.
The report provides three views of the swaps market: the gross notional outstanding value, the weekly transactions measured by dollar volume, and the weekly transactions measured by ticket volume. For each asset class, the report provides detailed breakdowns of the swaps market by product type, currency (six major currencies), tenor, participant type, and whether swaps are cleared or uncleared.
The Weekly Swaps Report is available at http://www.cftc.gov/MarketReports/SwapsReports.
In November 2012, the Commission began the publication of a proposed CFTC Weekly Swaps Report, with the goal of soliciting public feedback on its format, content, and supporting documentation. The preliminary version was populated with estimates derived from voluntarily supplied data and other external data sources. Commission staff incorporated feedback from comments, as well as from presentations to a number of other regulatory bodies, into the design of the current CFTC Weekly Swaps Report. Ongoing analysis by staff is designed to facilitate publication of data for the equity, foreign exchange, and commodities asset classes in FY 2014.
Publication of semiannual and annual swaps reports is expected to occur in FY 2014.
-
-
-
Goal Two—Protect the public and market participants by ensuring the financial integrity of derivatives transactctions, mitigation of systemic risk, and the fitness and soundness of intermediaries and other registrants.
In fostering financially sound markets, the Commission’s main priorities are to avoid disruptions to the system for clearing and settling contract obligations and to protect the funds that customers entrust to Futures Commission Merchants (FCMs), Swap Dealers, commodity pool operators (CPOs), Commodity Trading Advisors (CTAs) and other intermediaries. Effective regulatory oversight of clearing and intermediary entities is integral to the financial integrity of derivatives transactions, and by extension, the faith and confidence of market users. Key aspects of the CFTCs regulatory framework for achieving Goal Two are: 1) requiring that market participants post margin to secure their ability to fulfill financial obligations; 2) requiring participants on the losing side of trades to meet their obligations, in cash, through daily (sometimes intraday) margin calls; 3) requiring FCMs and other intermediaries to maintain minimum levels of operating capital; and, 4) requiring FCMs to segregate customer funds from their own funds. Additionally, with respect to CPOs and CTAs, the main mechanism for ensuring fitness and soundness is the data collected through the Forms CPO-PQR and CTA-PR.
Accomplishments related to progress in achieving this goal include:
- The Commission completed the annual examinations of SIDCOs where the Commission has been named the primary regulator. The Commission selected 6 core principles for one examination of a SIDCO. The core principles selected were based on a risk evaluation and consisted of financial resources, risk management, settlement procedures, treatment of funds, default rules and procedures, and public information.
- The Commission recommended a final clearing determination for certain classes of interest rate swaps and credit default swaps based upon the submissions of eight DCOs received in FY 2012, and comments received on its original proposal. On November 28, 2012, the Commission issued a final rulemaking based on this recommendation.
- Commission staff conducted daily stress tests of large cleared futures and options positions in energy, interest rate, equities, agricultural, soft agricultural, and metals asset classes.
- The Commission prepared for and initiated the process of registering two new categories of registrants – swap dealers and major swap participants. CFTC established and implemented a registration process for the new registrants and established registration criteria. CFTC handled innumerable registration and compliance issues, responded to industry interpretative questions, and provided timely no-action relief where necessary to allow an orderly implementation of the registration requirement.
- CFTC’s continued efforts to revise, refine, and enhance its examinations approach to place additional emphasis on risk and controls. In FY 2013, CFTC conducted a number of horizontal examinations incorporating this approach to include reviews of compliance with NFA Section 16 target residuals, internal audit control reviews, firm liquidity evaluations and an overall assessment of the initial filing of Chief Compliance Officer reports.
- In the aftermath of Hurricane Sandy, CFTC’s Examinations group coordinated with the SEC and FINRA and issued a joint staff advisory on lessons learned in disaster recovery to share best practices among the industry in preparation for future major operational disruptions.
Goal Two performance measure results are depicted in the following table:
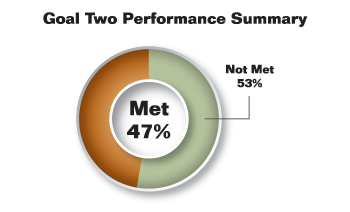
Goal Two Performance Results # of Measures5 Met Not Met Goal Two 17 8 9 % of Total 47% 53% 5 Excludes one performance measure categorized as “Not Applicable” for FY 2013. (back to text) -
Goal Two performance measures, analysis and review – Objective 2.1
PERFORMANCE MEASURE 2.1.1.1 Review systemically important DCOs annually. Percentage of SIDCOs reviewed.
FY 2013 Target: 100%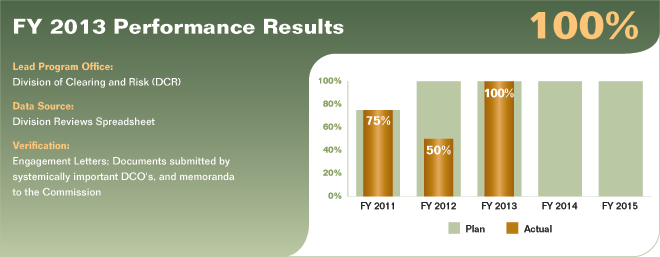
Performance Analysis & Review
The performance target was met for FY 2013. The Examinations Group completed the annual examinations of those DCOs that have been designated, pursuant to Title VIII of Dodd-Frank, as systemically important financial market infrastructures, by the Financial Stability Oversight Council (FSOC) where the CFTC has been named the primary regulator (SIDCO). The CFTC selected 6 core principles for one examination of a SIDCO. The core principles selected were based on a risk evaluation and consisted of financial resources, risk management, settlement procedures, treatment of funds, default rules and procedures, and public information. This was the first Title VIII examination of this entity. During this examination, two other Federal agencies participated and the CFTC led the efforts to coordinate fieldwork and post-fieldwork activities. As this was the first Title VIII examination, the core principles selected are those that are most important to the clearing operation and the risk management of that operation. The second SIDCO examination included a review of eight core principles. The core principles selected were based on a risk evaluation and consisted of financial resources, risk management, settlement procedures, treatment of funds, default rules and procedures, rule enforcement, system safeguards, and public information. This was the first Title VIII examination of this SIDCO. During this examination one other Federal agency participated and the CFTC led the efforts to coordinate fieldwork and post-fieldwork activities.
PERFORMANCE MEASURE 2.1.1.2 On a risk-based basis, review all other DCOs annually
to assess compliance with DCO core principles and Commission requirements.
FY 2013 Target: 100%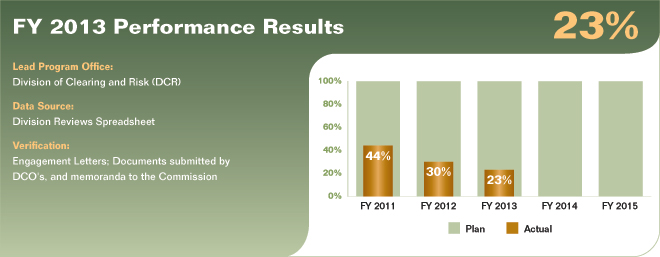
Performance Analysis & Review
The performance target was not met for FY 2013. During the review period there were two SIDCOs and 12 other Derivative Clearing Organizations (DCOs). The CFTC needed additional resources to review all 14 DCOs within a year. Instead the team made a risk assessment of the 12 DCOs and based on the results of the assessment, decided to review only a subset of the entire DCO community. CFTC determined that three DCOs would not be considered for an examination as one terminated its registration in April of 2013 and the other two cleared minimal trades during the review period. Of the remaining nine DCOs, two were selected for a review. The core principles selected for the reviews included financial resources, risk management, settlement procedures, treatment of funds, and public information. This approach allowed staff to compare policies and procedures consistently across all DCOs that were examined. The Commission was also charged with the responsibility of assessing compliance with Regulation 39.11 regarding DCOs’ financial resources. All DCOs submit quarterly filings to demonstrate compliance along with a certified financial statement at year-end. CFTC received and analyzed 86 filings consisting of 52 quarterly filings, 20 monthly filings, and 14 certified filings during the performance period. In addition CFTC received and analyzed 162 notice filings.
PERFORMANCE MEASURE 2.1.1.3 Percent of requests for Commission orders that are completed following review under the applicable provisions of the CEA.
FY 2013 Target: 94%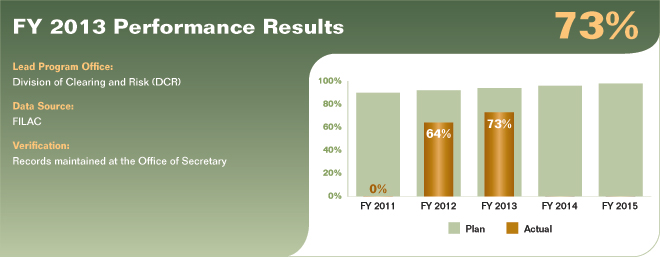
Performance Analysis & Review
The performance target was not met for FY 2013. The Commission issued several orders in response to requests from DCOs and other market participants during FY 2013. These include amending the DCO registration orders for Cantor Clearinghouse, LCH.Clearnet LLC, and Natural Gas Exchange (the amended registration order for Natural Gas Exchange also addressed the pending request for a Regulation 39.14(b) order permitting Natural Gas Exchange to use the accrual method of accounting for daily money settlement); an order vacating the DCO registration of Kansas City Board of Trade Clearing Corporation and transferring the open interest to CME Clearinghouse; two 4d orders permitting ICE Clear Credit and ICE Clear Europe, respectively, to commingle cleared security-based swaps and cleared swaps; and a 4d order permitting ICE Clear Europe to commingle foreign futures and futures, and to transfer cleared swaps positions and funds to Sections 4d(a) and 4d(b) accounts. The Commission also issued a final 4(c) order in response to a request from certain independent system operators and regional transmission organizations for a 4(c) order exempting certain transactions that are authorized by a tariff or protocol approved by the Federal Energy Commission or the Public Utility Commission of Texas. There are two pending requests for 4(c) orders that, if granted, would provide additional exemptive relief to California Independent System Operator (“ISO”) Corporation and ISO New England Inc., respectively, for inter-scheduling coordinator (“Inter-SC”) Trades and Internal Bilateral Transactions.
Due to the on-going need to prioritize tasks, it is anticipated that staff will continue to be limited in its ability to process requests for Orders (processing includes analyzing relevant legal and risk management issues, preparing a memorandum that documents the staff’s analysis, preparing the final Order, and briefing Commissioners regarding CFTC’s analysis and recommendations).
PERFORMANCE MEASURE 2.1.2.1 Applications are reviewed and a determination made regarding compliance with financial integrity provisions of the CEA within statutory time frames. Percent in compliance with financial integrity provisions.
FY 2013 Target: 100%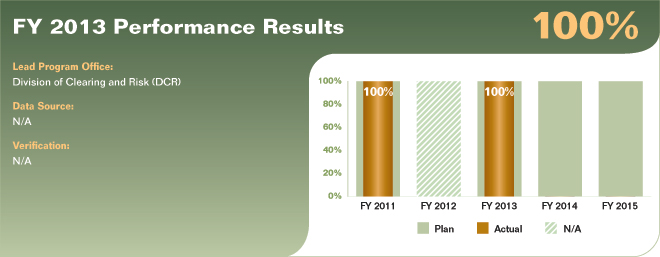
Performance Analysis & Review
The performance target was met for FY 2013. The CFTC completed its review of three DCM applications that were filed during FY 2013: Nodal Exchange LLC, EOX Exchange LLC, and GFI Futures Exchange LLC.
PERFORMANCE MEASURE 2.1.3.1 All material exceptions in monthly and annual financial filings by FCMs and RFEDs and notices of noncompliance with respect to minimum capital and segregation
are reviewed and assessed within one business day. Percent completed within one business day.
FY 2013 Target: 100%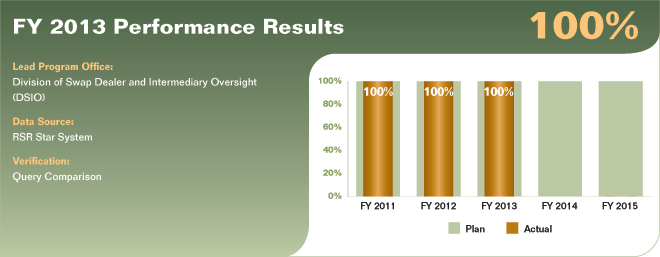
Performance Analysis & Review
The performance target was met for FY 2013. The Commission reviewed all 19 notices received within the targeted time of one business day. As appropriate, a follow up was performed with the filers and/or their Designated Self-Regulatory Organization (DSRO) to ensure that the fiscal integrity of the markets was maintained. Because segregated and secured funds are critical to the fiscal integrity of the market place and to customer financial protection, the ability to meet this target is vital to the Commission’s financial oversight mission.
PERFORMANCE MEASURE 2.1.3.2 On a risk-based basis, conduct direct examinations of FCMs
and RFEDs, identify deficiencies, and confirm that all deficiencies identified are corrected within
the specified period of time. Percent corrected within specified time period.
FY 2013 Target: 94%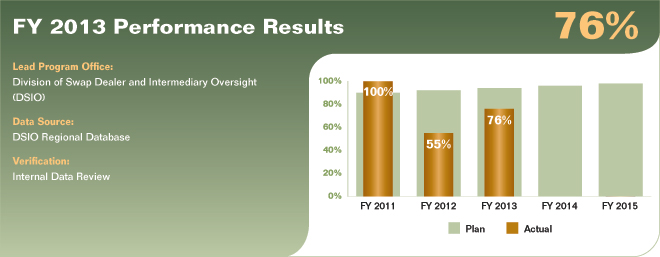
Performance Analysis & Review
The performance target was not met for FY 2013. Although the Commission had planned to conduct limited-scope, risk-based examinations comparable in number to what had been performed in FY 2012 (17); only 13 examinations were performed in FY 2013 due primarily to resource constraints and other mission priorities. However, for these examinations, all deficiencies identified were corrected within the specified time period.
The examinations performed in FY 2013 were very limited reviews that were reactive to the market place. In addition, the scope of the reviews was further reduced to target areas of greatest risk to the market or to firm customers. Examples of high risk focus areas include risks unique to the firm (as identified through our monitoring process) and, as in the case of a liquidity review, the aspects of a firm’s operations most likely to cause harm to customers or threaten market financial integrity. Since 2011, examination production (which exceeded 30 reviews two years ago) has dropped by nearly 60 percent (to the 13 reviews conducted in FY 2013). If not addressed, the Commission believes that operational capacity will be further eroded by the work demands of SD/MSP oversight which will begin to demand additional staff time as the Commission approaches the conclusion of the initial registration process.
PERFORMANCE MEASURE 2.1.4.1 Reviews of swaps submitted to the Commission are completed within statutory and regulatory deadlines.
FY 2013 Target: 100%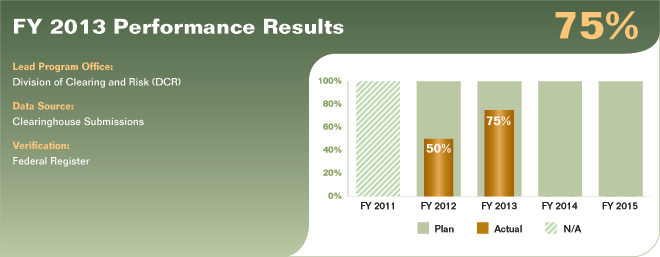
Performance Analysis & Review
The performance target was not met for FY 2013. In FY 2013, a final clearing determination was recommended for certain classes of interest rate swaps and credit default swaps based upon the submissions of eight DCOs received in FY 2012. On November 28, 2012, the Commission issued a final rulemaking based on this recommendation. The CFTC continued to review DCO submissions (12 filings in total), and considered recommendations for the Commission as staff resources permitted. Staff finalized exemptions from clearing in FY 2013 for certain inter-affiliate transactions, certain treasury affiliates and for co-operatives. Staff began the process of establishing procedures for the monitoring of the clearing requirement and in fact engaged in extensive dialogue with market participants, including SDRs regarding data submissions.
PERFORMANCE MEASURE 2.1.5.1 Reviews of DCO rules submitted to the Commission are
completed within statutory and regulatory deadlines.
FY 2013 Target: 100%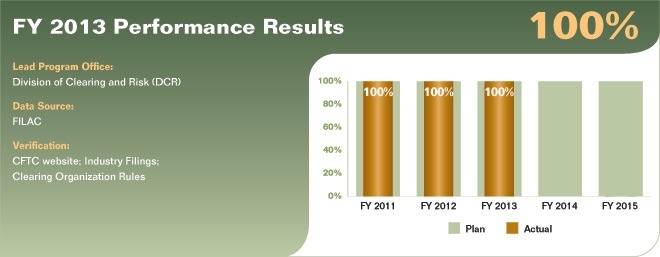
Performance Analysis & Review
The performance target was met for FY 2013. Rules include not only provisions contained in a DCO’s rulebook, but also issuances such as interpretations, policies, and clearing member advisories. During this performance period, 158 DCO rules were filed as self-certifications under Regulation 40.6, one rule was filed for approval under Regulation 40.5, and four rules were filed under Regulation 40.10, which requires that a SIDCO provide notice to the Commission not less than 60 days in advance of any proposed change to its rules, procedures, or operations that could materially affect the nature or level of risks presented by the SIDCO.
PERFORMANCE MEASURE 2.1.6.1 Perform risk analysis and stress-testing on large trader and clearing member positions to ascertain those with significant risk and confirm that such risks are being appropriately managed. Number of positions analyzed.
FY 2013 Target: 600,000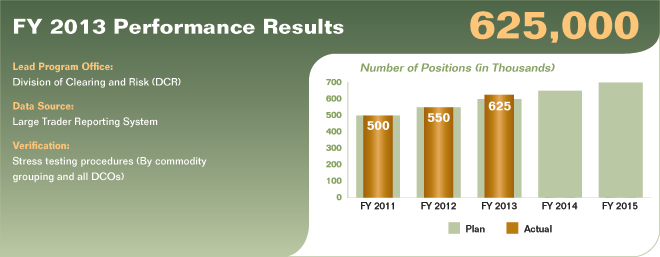
Performance Analysis & Review
The performance target was met for FY 2013. The Commission has developed a comprehensive understanding of the risk of cleared futures positions across all Derivatives Clearing Organizations.
Staff members conduct daily stress tests of energy, interest rate, equities, agricultural, soft agricultural, and metals account and firm positions. Stress tests are performed at a variety of levels (e.g., all time move and 150 percent of product margin requirements) and results are compared to a variety of metrics (e.g., excess net capital and margin on deposit). Stress tests are also performed across multiple commodity groups.
The CFTC conducted a wide variety of risk analysis on large trader and clearing member positions, relying primarily on the Integrated Surveillance System (ISS) and Stressing Positions at Risk (“SPARK”) databases in conjunction with Standard Portfolio Analysis of Risk (“SPAN®”) Risk Manager Software. In addition, staff conducted financial analysis of clearing members using Regulatory Statement Review (“RSR”) Express. Through the use of these and other systems Commission staff members identify traders with the greatest overall market risk and those that pose a material risk to their clearing members.
PERFORMANCE MEASURE 2.1.6.2 On a risk-based basis, meet with large traders, FCMs, SDs,
and other industry participants to discuss risk management issues. Number of entities met with
and risk issues reviewed.
FY 2013 Target: 132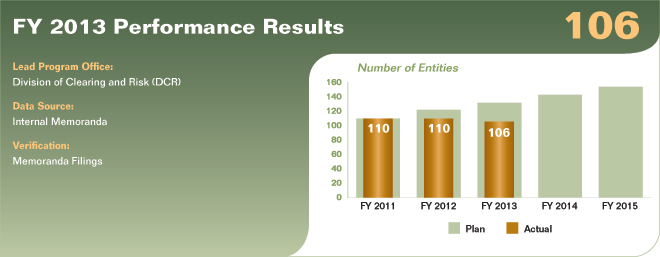
Performance Analysis & Review
The performance target was not met for FY 2013. Meeting with large traders, FCMs, SDs, and other industry participants require travel resources that the CFTC lacked. The travel funds for FY 2013 were considerably lower than in past years. The Commission is currently conducting reviews as funds become available and working on developing a plan to conduct phone interviews with market participants. These phone interview reviews will generally be less comprehensive.
The Commission was able to conduct several FCM and large trader reviews in the Chicago area that did not require travel funds. With these reviews the Commission was able to initiate its new Regulation 1.73 review program. The program involves testing for FCM’s compliance with Regulation 1.73 requirements. These requirements include several aspects (e.g. stress testing and liquidity). Additionally, when the Commission had funds available to travel, Commission staff always ensured multiple reviews were conducted on each trip.
-
Goal Two performance measures, analysis and review – Objective 2.2
PERFORMANCE MEASURE 2.2.2.1 Under a risk-based approach, conduct reviews of selected programs of all RFAs to assess fulfillment of statutory and delegated responsibilities and confirm
that any deficiencies identified are corrected within the specified period of time. Percent of
deficiencies corrected within specified time period.
FY 2013 Target: 94%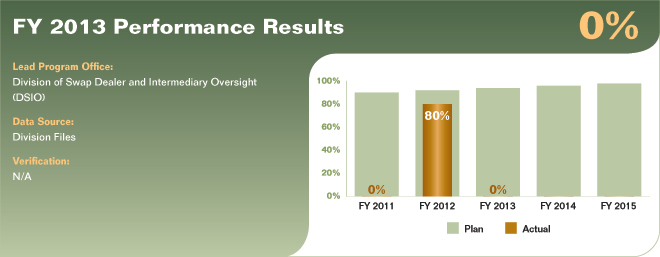
Performance Analysis & Review
The performance target was not met for FY 2013. The workload demands of Dodd-Frank rule implementation in combination with resource constraints resulted in the inability to conduct reviews of Registered Futures Associations (RFAs). The lack of RFA program reviews by Commission staff may result in deficiencies going uncorrected and impairment of the Commission’s regulatory mission. Moving forward, the Commission plans to continue its work to identify staffing efficiencies and explore other alternatives to identify the dedicated resources necessary to complete this measure.
PERFORMANCE MEASURE 2.2.2.2 Percentage of RFA rules submitted for which determinations
are made within statutory time frames.
FY 2013 Target: 94%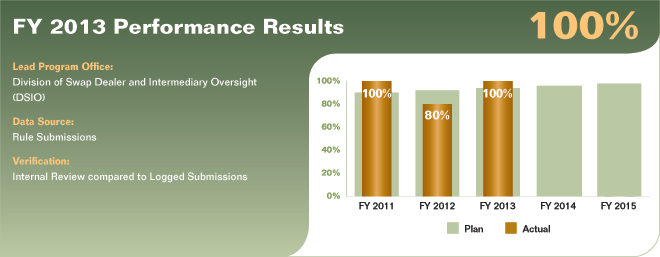
Performance Analysis & Review
The performance target was met for FY 2013. All RFA rules submitted were evaluated and appropriate determinations were completed within the time allowance required by the measure. Examples of RFA rules evaluated during the performance year included National Futures Association (NFA) amendment proposals regarding Bylaw 1301(f) regarding Dues Revenue Structure for Swap Dealer and Major Swap Participant Members and to the Articles of Incorporation to Integrate Swap Dealers and Major Swap Participants into NFA’s Membership and Governance Structure.
PERFORMANCE MEASURE 2.2.3.1 On a risk-based basis, conduct direct examinations of non-FCM intermediaries, identify deficiencies, and confirm that any deficiencies identified are corrected within the specified period of time. Percent of time that deficiencies are corrected within specified time period.
FY 2013 Target: 94%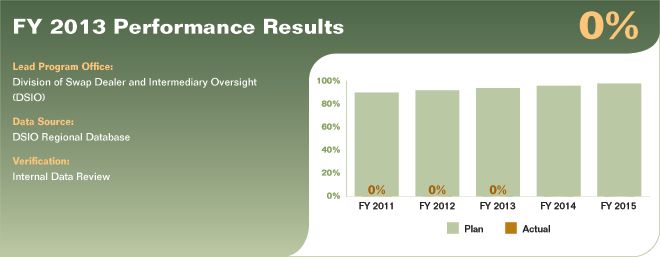
Performance Analysis & Review
The performance target was not met for FY 2013. The Commission chose not to review any non-FCM intermediaries in favor of relying on National Futures Association (NFA) to perform such examinations given limited resources and the on-going need to prioritize tasks based on overall importance to the financial markets, customer protection and other factors.
As the new SD/MSP registration process continues, there will be an even greater need to balance and prioritize the allocation of staff resources moving forward.
-
Goal Two performance measures, analysis and review – Objective 2.3
PERFORMANCE MEASURE 2.3.1.1 On a risk-based basis, review all SROs annually to assess compliance with CEA and Commission requirements, identify deficiencies, and confirm that any deficiencies identified are corrected within the specified period of time. Percent of time in which deficiencies are corrected within specified time period.
FY 2013 Target: 94%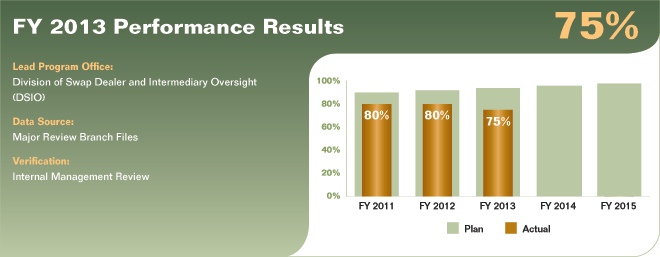
Performance Analysis & Review
The performance target was not met in FY 2013. The Commission reviews Self-Regulatory Organizations (SROs) to assess compliance with the CEA and Commission requirements. Due to resource constraints, only 75 percent of the planned number of reviews was completed and none of the draft reports were submitted to the affected SROs in final form. Nevertheless, all reviews were completed in a thorough and timely manner and any significant issues or findings were communicated to the SRO immediately.
As budgetary and staffing constraints continue, the Commission will maintain its efforts to seek innovative ways to complete and finalize these reviews.
PERFORMANCE MEASURE 2.3.1.2 Percentage of direct examinations of registered intermediaries
that confirm proper execution of SRO programs.
FY 2013 Target: 94%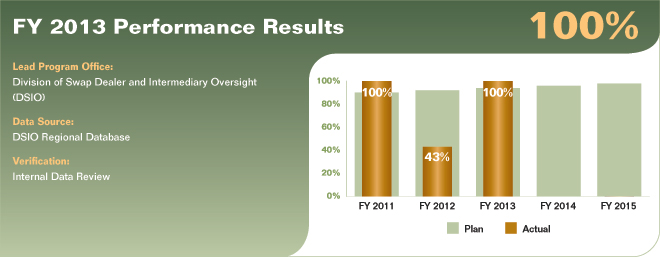
Performance Analysis & Review
The performance target was met for FY 2013. The Commission performed 27 limited-scope (direct or “for cause”) reviews. The primary goal of the Commission direct reviews is to confirm the SROs properly execute their financial surveillance programs. The majority of these reviews were of FCMs who are the principal repository for funds used to margin commodity trading by both customer and proprietary account holders. Although the Commission met this goal in light of the high importance of FCM oversight to its financial integrity mission, this performance came at the expense of other important areas.
-
Goal Two performance measures, analysis and review – Objective 2.4
PERFORMANCE MEASURE 2.4.1.1 Program redesign to cover new registrants monitored by the
RSR and SPARK systems. Percentage of system redesign accomplished.
FY 2013 Target: 95%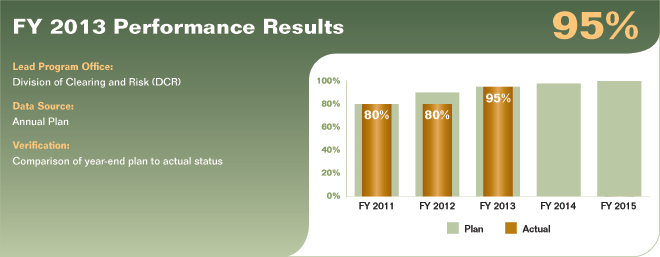
Performance Analysis & Review
The performance target was met for FY 2013. The Commission conducted risk surveillance activities through the use of automated financial and risk surveillance systems and applications such as Regulatory Statement Review (RSR) Express and Stressing Positions at Risk (“SPARK”) databases. Staff members use RSR Express to receive and review monthly Futures Commission Merchants (FCMs) financial statements, and SPARK to identify volatile markets, firms that have positions on the losing side of the market, and customers at the identified firms. Large trader positions are downloaded into an application that allows for the margining and stress testing of positions. Both RSR Express and SPARK applications were developed in-house.
PERFORMANCE MEASURE 2.4.1.2 Program design to cover new data collection requirements
to monitor systemic risk posed by CPOs and CTAs advising private funds, and new registration
of swap dealers. Percentage of system design accomplished.
FY 2013 Target: 95%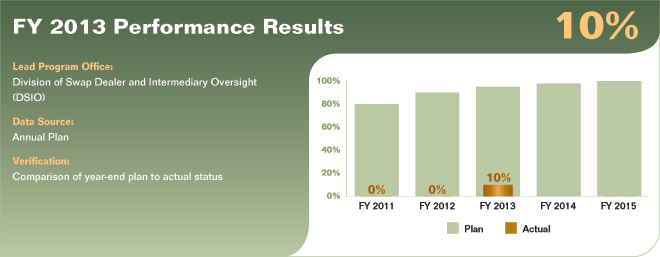
Performance Analysis & Review
The performance goal was not met in FY 2013. However, significant progress was made in this area relative to the Commission’s previous reports, which had identified the goal as not reportable because it was Dodd-Frank dependent. Given the CFTC’s progress in implementation of the Dodd-Frank rules, Commission has established an initial framework regarding the use of the new data collection applicable to CPOs and CTAs. The CFTC’s goal to provide CPO/CTA data to the FSOC regarding systemic risk and to participate in the IOSCO hedge fund survey has been negatively impacted due to resource constraints. Moving forward, the Commission will seek to identify resource solutions and efficiencies to continue progress on this mission critical goal.
-
-
-
Goal Three—Protect the public and market participants through a robust enforcement program.
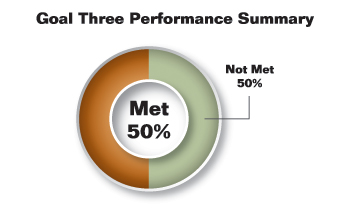
The Commission is committed to prosecuting violations of the CEA and Commission regulations to protect market participants and promote market and financial integrity. The Commission investigates and litigates cases that have the greatest impact, whether they are against some of the world’s largest financial institutions for attempted manipulation, false reporting, customer fund violations, wash trading, or supervision failures, or against a Ponzi schemer who perpetrates a multi-million dollar scam on the unsuspecting public. CFTC filed 82 enforcement actions in FY 2013 and obtained orders imposing more than $1.7 billion in sanctions, including orders for more than $1.5 billion in civil monetary penalties and more than $200 million in restitution and disgorgement. Other accomplishments include:
- CFTC’s benchmark cases in FY 2013 brought enforcement actions against five major financial institutions and corporate market participants – UBS AG, UBS Securities Japan Co., Ltd., Royal Bank of Scotland, RBS Japan Securities Ltd., and ICAP Europe Limited – for their unlawful manipulative conduct and false reporting with respect to London Interband Offered Rate (LIBOR) and other benchmark interest rates. The CFTC imposed over $1 billion in civil monetary penalties in these actions and required compliance with specific undertakings designed to ensure the integrity of the LIBOR and other benchmark interest rate markets in the future. The CFTC’s enforcement efforts regarding the LIBOR and other benchmark interest rates in FY 2013 (which continue today) are of significant national, and international, importance given that these benchmark rates are incorporated into a broad array of financial transactions, including mortgages, loans, credit card fees, and certain financial derivatives.
- The CFTC also filed and settled cases totaling $380 million in areas such as the protection of customer funds (MF Global, Peregrine, and others), trading violations, futures commission merchant and introducing broker supervision violations, and precious metals fraud charges.
Goal Three performance measure results are depicted in the following table:
Goal Three Performance Results # of Measures6 Met Not Met Goal Three 2 1 1 % of Total 50% 50% 6 Excludes one performance measure categorized as “Not Applicable” for FY 2013. (back to text) -
Goal Three performance measures, analysis and review – Objective 3.1
PERFORMANCE MEASURE 3.1.1.1 Percentage of enforcement investigations concluded within
one year of opening.
FY 2013 Target: 75%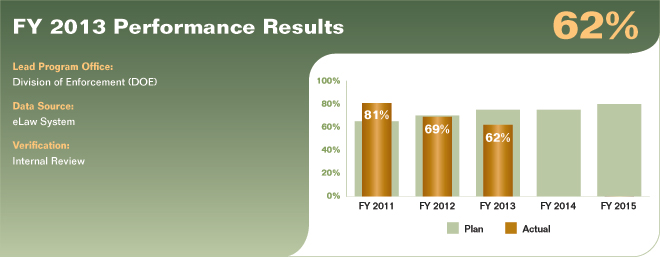
Performance Analysis & Review
The performance target was not met for FY 2013. Of the 286 investigations closed during FY 2013, including those of fraud, abusive trading practices, and manipulation, the CFTC concluded 177 within one year of opening. A further breakdown of the investigations completed in under a year finds that 98 closed in six months or less (34 percent).
The number of CFTC enforcement investigations opened has risen sharply in recent years—from 99 in FY 2007 to over 350 in FY 2012, and over 290 in FY 2013—due to a combination of factors, including the clarification of the Commission’s authority over off-exchange traded forex (foreign exchange currency), and cooperative enforcement efforts. The Commission is also experiencing an uptick in the number of market manipulation and disruptive trading investigations, which are complex and resource intensive.
The Commission’s FY 2013 Plan target for this performance measure took into account these factors, as well as historical performance and staffing constraints. Despite these factors and constraints, the Commission approached its target for this performance measure, and remains committed to the effective and expeditious disposition of its enforcement investigations.
-
Goal Three performance measures, analysis and review – Objective 3.2
PERFORMANCE MEASURE 3.2.1.1 Percentage of CFTC case filings that include referrals to domestic civil and criminal cooperative authorities.
FY 2013 Target: 70%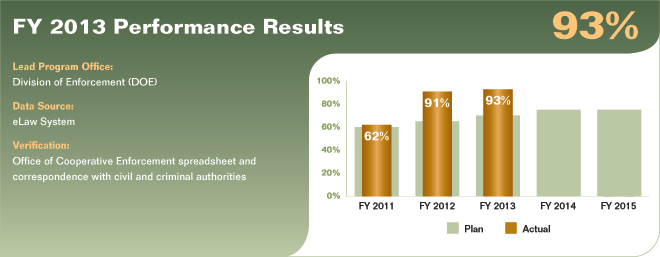
Performance Analysis & Review
The performance target was met for FY 2013. During FY 2013, there were 82 enforcement actions filed. Of these actions, 36 did not merit referral to other agencies because they involved registration, supervision, and segregation violations. These matters were not referred because they did not involve substantive violations of other criminal or civil government agency laws. Of the remaining 46 matters, 43 of those matters involved cooperative enforcement referrals between the Commission and other agencies. The Commission referred 22 matters to other agencies and 21 matters were referred to the Commission in connection with a prior ongoing investigation by another agency. This translates to a 93% referral rate.
-
-
-
Goal Four—Enhance integrity of U.S. markets by engaging in cross-border cooperation, promoting strong international regulatory standards, and encouraging ongoing convergence of laws and regulation worldwide.
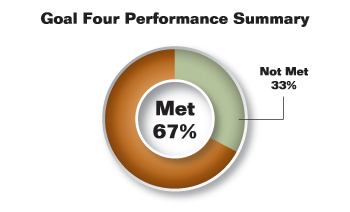
The implementation of comprehensive regulations under the Dodd-Frank Act legislation marks a new era in the swaps marketplace by mandating, among other things, the regulation of Swap Dealers (SDs), clearing of swaps, and transparency with respect to those transactions. However, regulation in the United States alone will not be sufficient to protect the global financial system. Because the swaps market is conducted on a global basis, it is possible for swaps executed offshore by U.S. financial institutions to transmit the risk of those transactions back to the United States. This already has transpired with the offshore affiliates of AIG, Lehman Brothers, Citigroup, Bear Stearns, and Long Term Capital Management, and most recently when JPMorgan Chase executed swaps through its London branch.
Recognizing this risk, the United States joined with other G-20 leaders in 2009 to require that all major market jurisdictions bring swaps under regulation. Since that date, the Commission has been engaged in an unprecedented outreach to major market jurisdictions and expanded involvement in numerous international working groups to encourage the adoption of robust swaps regulation.
This added emphasis on swap market regulation supplements the Commission’s long-standing engagement with foreign regulators to establish and enforce customer and market protection arrangements in derivatives trading, including the Commission’s participation in the IOSCO Multilateral Memorandum of Understanding, which enables the Commission to obtain cooperation from approximately 100 foreign regulators in enforcement matters. The Commission’s recent successes in bringing LIBOR actions involved valuable assistance from the Commission’s cooperative relationships with its counterpart foreign regulators which aided the Commission’s ability to obtain evidence of the widespread wrongdoing. The Commission also remains committed to taking a strong role in international standard-setting organizations such as IOSCO, which recently recognized the Commission’s long history of contributions by voting to make the Commission a full member.
CFTC also provides technical assistance to emerging and recently-emerged markets to help these jurisdictions in establishing and implementing laws and regulations that foster global market integrity. The Commission’s international training symposium has consistently attracted wide attendance by foreign regulators who look to the Commission as a global standard setter in derivatives regulation.
Accomplishments related to progress in achieving this goal include:
- The Commission worked with leaders of international authorities with responsibility for the regulation of the OTC derivatives markets in major market jurisdictions to support the adoption and enforcement of rigorous and consistent standards in and across jurisdictions and to develop concrete and practical solutions to conflicting application of rules and identify inconsistent or duplicative requirements.
- The CFTC worked throughout the year with foreign authorities, including the European Commission, European Securities Market Authority, and other foreign regulators to coordinate policies and to develop memorandum of understanding and other cooperative arrangements that will be needed to implement final Commission Dodd-Frank rules for market infrastructure and participants (e.g., with regard to SDRs, SDs, DCOs, and SEFs).
Goal Four performance measure results are depicted in the following table:
Goal Four Performance Results # of Measures7 Met Not Met Goal Four 3 2 1 % of Total 67% 33% 7 Excludes one performance measure categorized as “Not Applicable” for FY 2013. (back to text) -
Goal Four performance measures, analysis and review – Objective 4.1
PERFORMANCE MEASURE 4.1.1.1 Days allotted for acknowledgment of incoming requests for enforcement assistance from our international counterparts pursuant to our information sharing arrangements.
FY 2013 Target: 3 Days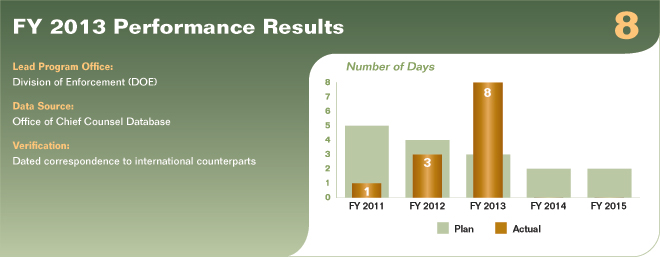
Performance Analysis & Review
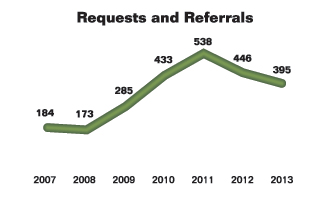
The performance target was not met for FY 2013. The Commission handled just under 400 international requests and referrals. The Commission also entered into bilateral cooperative enforcement/information sharing arrangements with more than 25 foreign authorities. In 2002, the Commission entered into a multilateral information sharing arrangement established by IOSCO which has become the gold standard for such international multilateral memoranda of understanding (MMOU). Ninety-nine IOSCO members have signed the MMOU. In addition, the Commission is authorized to cooperate and exchange information with foreign authorities worldwide (both with MMOU partners and with other, non-MMOU authorities) on a case-by-case basis.
-
Goal Four performance measures, analysis and review – Objective 4.2
PERFORMANCE MEASURE 4.2.1.1 Number of international regulatory and standard-setting working groups in which the Commission participates.
FY 2013 Target: 9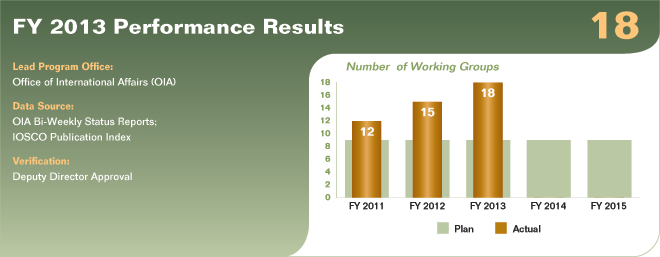
Performance Analysis & Review
The performance target was met for FY 2013. The Commission provides representation on numerous international organizations, standard-setting bodies, and other groups, which is discussed further below. The Commission’s primary pathway for influencing the development of global international standards is through its participation on the Board of the International Organization of Securities Commissions (IOSCO), its numerous standing committees and task forces. The Commission recently enhanced its stature within IOSCO by becoming a full member of that body. Moreover, in the past year, consistent with the Commission’s expanded remit under the Dodd-Frank Act, the Commission has expanded its participation to a wider range of bodies and, in particular, has enhanced its cooperation with international regulatory bodies in the banking area to address issues of mutual concern.
-
Goal Four performance measures, analysis and review – Objective 4.3
PERFORMANCE MEASURE 4.3.1.1 Number of non-U.S. regulators trained.
FY 2013 Target: 200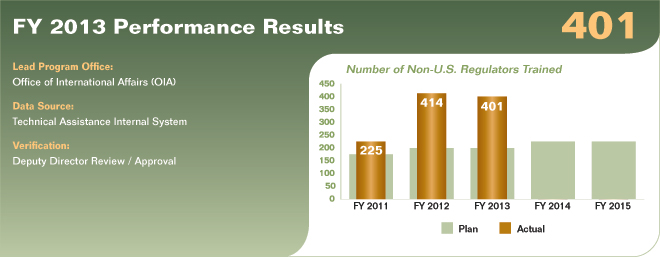
Performance Analysis & Review
The performance target was met for FY 2013. The CFTC coordinates a variety of technical assistance activities: visits by foreign regulators for discussions with Commission staff on a variety of technical regulatory matters, on-site missions by Commission staff to share regulatory approaches with foreign regulators and market authorities, and the annual symposium and training seminar for foreign regulators.
For example, during FY 2013, the governments of China and Thailand requested and funded an on-site technical assistance programs. Commission staff traveled to Beijing and Bangkok to deliver one-week programs on commodity futures regulation to more than 90 staff of the China Securities Regulatory Commission (CSRC) and the Agriculture Futures Trading Commission (AFTC). The Commission’s FY 2013 symposium and training seminar for international regulators attracted 58 participants from 19 countries.
-
-
-
Goal Five—Promote Commmmission excellence through executive directction and leadership, organizational and individual performance management, and effectctive management of resources.
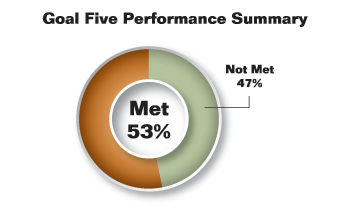
Strategic Goal Five addresses those areas that enable the Commission to execute its mission of protecting market users and the public from fraud, manipulation, and abusive practices. Excellence in this area is reflected in strong and focused planning and governance, top notch IT and infrastructure, sufficient facilities, efficient execution of resources, and an educated and productive workforce. FY 2013 proved exceptionally challenging as financial resources were constrained by sequestration, despite mission need for enhanced infrastructure and improvement of various administrative systems and services. Due to limited resources, the CFTC prioritized the mission essential support requirements that directly impacted its ability to meet Dodd-Frank Act initiatives while maintaining excellence monitoring the futures market. The key results summarize CFTC’s mission support strategy.
- Through system and process modernization, CFTC implemented a web-based time and attendance system eliminating the need for a paper-based process; an enterprise-wide business information system providing standardized, authoritative source data for budget formulation and archival change records; and new budget program activity codes resulting in systemic efficiencies and effective processing of financial management data.
- The Commission continued to build a dynamic knowledge base for the CFTC. This was achieved through the deployment of an agency-wide needs assessment, the implementation of a redesigned individual development plan program, the design and execution of in-house knowledge sharing workshops and e-learning initiatives, and the procurement of instructor-led regulatory and professional development learning engagements.
- To expand CFTC’s compliance with the Federal Information Security Management Act, the Commission entered into a contract for a Personally Identifiable Information inventory, a review of NFA’s privacy policies, and other privacy support. The Commission also removed social security numbers from all CFTC forms and developed a new privacy threshold analysis that allows the procurement staff to determine which contracts require a privacy impact assessment.
- To help the effective transition of its workforce to the Dodd-Frank Act regulatory environment, the Commission leveraged cloud-based, software-as-a-service (SaaS) solutions to improve the hiring, training, and learning management, and staff time reporting processes. To increase the use and effectiveness of SaaS to support management and administration, the Commission also consolidated administrative and staff data into a central database supported by web services. In addition to allowing the Commission to streamline vendor management, staff and contractor, and ethics compliance processes, this has also allowed for the consolidation and increased control over sensitive personally identifiable information.
- The Commission continued to meet goals for implementing business continuity IT support. All Commission data and systems are now replicated to a co-located alternate computing facility (ACF). An initial test of fail-over and restoration capability targeted for FY 2014 was conducted successfully in November of 2013.
- A CFTC-wide business process management system (BPMS) platform is now in place and will support automation of key regulatory and mission support business process as funding for Dodd-Frank implementation becomes less constrained. Automated systems supporting tips, complaints, and referrals and early case assessment of large enforcement action document collections were completed.
- Commission staff has direct access to Swaps Data Repository (SDR) data through regulatory portals provided by the SDRs. While staff is still defining surveillance requirements in order to identify the subset of SDR data that will be pushed to CFTC systems, the Commission is working with industry participants to harmonize data across SDRs, improve data consistency, and fully establish global legal entity and product identifier standards.
- The Commission is continuing to transition to standards-based regulatory data reporting using established industry standards like FpML and FIXML. This transition, together with the full implementation of global legal identity and product identifiers will enable the Commission to integrate futures and swaps information in the CFTC data environment and more effectively aggregate information.
Goal Five performance measure results are depicted in the following table:
Goal Five Performance Results # of Measures Met Not Met Goal Five 15 8 7 % of Total 53% 47% -
Goal Five performance measures, analysis and review – Objective 5.1
PERFORMANCE MEASURE 5.1.1.1 Executive approval and Commission adoption of efficient
and effective organizational design.
FY 2013 Target: Use established organizational change procedures to adjust and improve organizational structure as needed.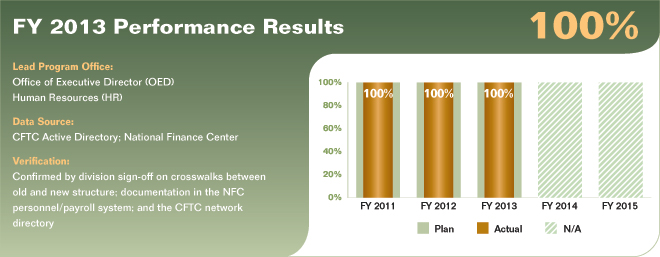
Performance Analysis & Review
The performance target was met for FY 2013. Two small organizations within the CFTC, the Business Management and Planning Branch and the Whistle Blower Office, requested and received realignment or improvement to their organizational structure in FY 2013. The agency’s structure and functions will continually be assessed in order to achieve the optimal grouping of functions, reporting relationships, and work flow to support mission and goals assigned by law or regulation in the most effective, efficient, and economical manner.
-
Goal Five performance measures, analysis and review – Objective 5.2
PERFORMANCE MEASURE 5.2.1.1 Develop, adopt, and implement a comprehensive planning process.
FY 2013 Target: Implement new BPAC; track major projects & activities; implement automated
time & attendance.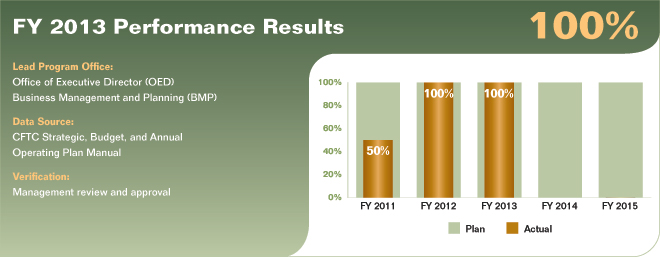
Performance Analysis & Review
The performance target was met for FY 2013. The new Budget Program Activity Code (BPAC) structure was implemented agency-wide on October 1, 2012 and the automated time & attendance system was implemented in July, 2013. The tracking of major projects and activities continues to be accomplished via the OED Performance Plan, which is updated quarterly.
-
Goal Five performance measures, analysis and review – Objective 5.3
PERFORMANCE MEASURE 5.3.1.1 Assess, develop, and implement automated hiring system.
FY 2013 Target: Optimize automated hiring system and associated business processes. Demonstrate reduction in FTE years dedicated to recruitment and staffing.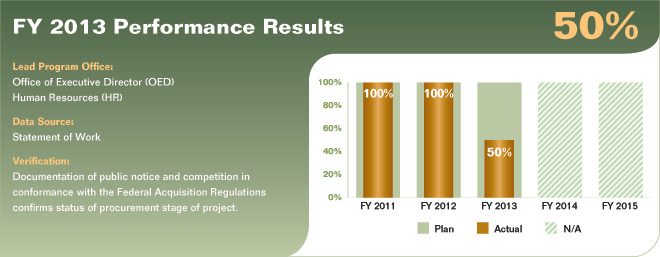
Performance Analysis & Review
The performance target was not met for FY 2013. The Commission implemented the Monster Government Solutions hiring tool in September 2012, which is an Automated Hiring System that accepts, examines, and refers applications to hiring managers electronically.
Since implementation, the Human Resources Branch has continued to develop questions to support the question library for all Commission occupations. Human Resources is working with the Office of Data and Technology to determine if efficiencies can be gained by entry of data into Monster that can be interfaced with multiple systems in order to produce hiring metrics for regular reporting. This ability would allow for more accurate and consistent data in multiple systems without rekeying data and improve the workflow for hiring.
The second component of the goal was not met. Prior to September 2012, hiring at the CFTC was primarily a manual process which required significant manpower and time to complete. Although the system has created enhanced efficiencies for a segment of the staffing activities concerning the collection and initial screening of applications, because of the labor-intensive nature, scope and framework associated with adequately staffing positions, no savings in full time staff years has been realized yet.
However, the streamlined automated hiring process has aided the Commission’s ability to meet the Office of Personnel Management’s 80 day hiring timeline in 2013. The Commission will continue to see benefits from this new online tool as more efficiency is gained.
PERFORMANCE MEASURE 5.3.1.2 Improve time to hire from 150 days to 80 days.
FY 2013 Target: Improve time to hire by 10% in each of the next three years—saving 12 days.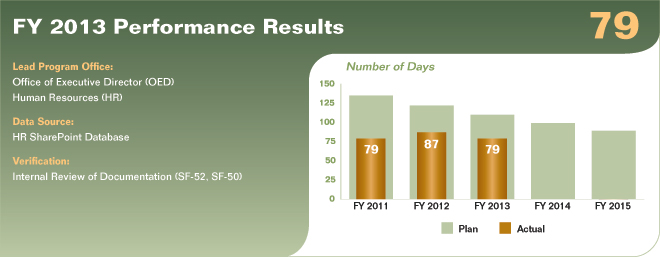
Performance Analysis & Review
The performance target was met for FY 2013. The hiring cycle is based on entrance duty dates between October 2012 and September 2013. The Commission’s time to hire metric decreased by 8 days from 87 in 2012 to 79 days in 2013. The Commission was able to exceed the OPM 80 day metric in the first and second quarters of FY 2013. In April of 2013, the Commission experienced severe budget shortfalls because of the Sequestration Act and a continuing resolution. This required the Commission to impose a strict hiring freeze on all positions.
PERFORMANCE MEASURE 5.3.2.1 The CFTC is consistently rated by its employees as a small
agency workplace of choice and listed annually as one of the top 10 best places to work in the
Federal government (small agency category). The CFTC identifies low scores determined to be
of most significance to the Commission year over year to inform its improvement plans.
FY 2013 Target: Top 10 rating. Incorporate survey information into human capital strategic planning.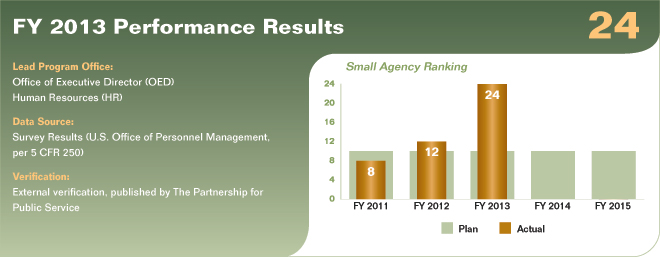
Performance Analysis & Review
The performance target was not met for FY 2013. The results of the 2013 Federal Employee Viewpoint Survey (FEVS), released by the U.S. Office of Personnel Management (OPM), are being evaluated by the Office of the Executive Director (OED) to assess employee perceptions of the CFTC work environment. The Partnership for Public Service released its “Best Places to Work” rankings for 2013 on December 18, and CFTC has dropped to 24th among small agencies. Coupled with the feedback received from the listening sessions facilitated by the Human Resources Branch and the Office of Diversity and Inclusion (ODI); the CFTC Suggestion Program; and the FEVS survey results, the CFTC will continue to use this information to identify and implement actions to effect the changes in employee engagement and satisfaction to recapture our ranking as a small agency workplace of choice and being listed as one of the top ten best places to work in the federal government (small agency category).
More information on the ratings of the CFTC can be found on The Best Places to Work in the Federal Government website, http://bestplacestowork.org/BPTW/rankings/detail/CT00.
PERFORMANCE MEASURE 5.3.3.1 Develop and implement comprehensive development and
education program.
FY 2013 Target: Increase by 10 to 25% over previous year the percentage of CFTC employees participating in CFTC’s training program as funding and resources available will allow.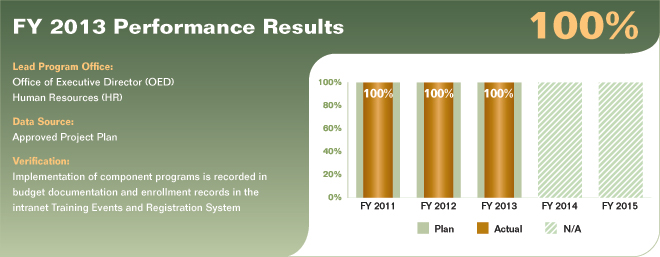
Performance Analysis & Review
The performance target was met for FY 2013. Significant progress was made in the educational attainment of employees despite a 61% decrease in the FY 2013 budget allocation for talent and development. Within a limited budget profile, deployment of the mandatory Information Technology and Privacy training was executed with a 99.3% completion rate from both Federal Employees and contractors. An agency-wide training campaign was deployed and returned a 100% completion rate by federal employees. A customized Division of Enforcement internal learning program of six modules was designed, developed and deployed. This program addressed specific learning requirements of both Enforcement Investigators and Trial Attorneys. Individual Development Plan training was designed and is now available for CFTC staff. The Commission provided training to 100% of the individuals who were new to a supervisory position in FY 2013 and 100% of employees who have a responsibility to oversee federal contracts.
Further, the Commission was able to increase participation in training activities by 10% proportional to FY 2012 participation and funding level rates. The Commission was able to be more efficient with funding levels received by focusing on internally designed and developed training programs and by promoting eLearning options including expanding participation of staff in utilizing course offerings from the Practicing Law Institute, and financial market courses offered online by Intuition.
PERFORMANCE MEASURE 5.3.3.2 Assess requirements, design, and implement a comprehensive CFTC-wide mentoring program focused on enhancing the competencies of CFTC’s current and
future workforce.
FY 2013 Target: Increase participation in mentoring program 5-10% over previous year.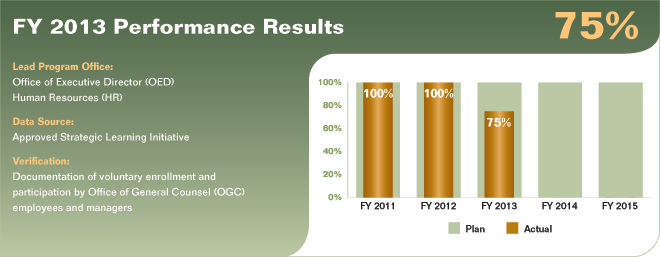
Performance Analysis & Review
The performance target was not met for FY 2013. Due to a limited funding profile, the mentoring program was not fully deployed in FY 2013. CFTC held two successful mini-mentoring pilots and plans to leverage the lessons learned from those pilots to launch a larger, CFTC-wide mentoring program that is designed to support enhanced goals and responsibilities resulting from the Dodd-Frank Act. The program will provide CFTC leaders and senior level employees an opportunity to share their unique knowledge and skills with newer staff and also provide a formal opportunity for newer employees to gain a better understanding of the Commission’s mission & vision while providing support for career enhancement. The program promotes a robust learning culture which actively values ongoing learning and professional development, encourages greater communication, and improves cooperation and collaboration throughout the agency. The design and the development of this program are complete.
-
Goal Five performance measures, analysis and review – Objective 5.4
PERFORMANCE MEASURE 5.4.1.1 Transparency and process maturity of IT governance for
reinforcing business unit and IT partnership.
FY 2013 Target: Institute CFTC-wide Data Management.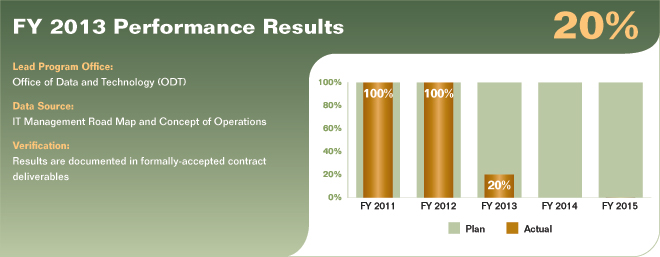
Performance Analysis & Review
The performance target was not met for FY 2013. An assessment of CFTC’s current data management maturity level was completed. A roadmap that summarizes, sequences, and identifies resources and level of effort for activities that will improve CFTC data management was developed. Due to resource constraints, the maturity level assessment and roadmap development took longer than estimated. Several near-term activities identified by the roadmap are active, but executing at constrained resource levels. The Commission is establishing a standardized data requests process, but other activities identified by the roadmap are on hold.
PERFORMANCE MEASURE 5.4.1.2 Implementation of IT strategy and architecture for business continuity.
FY 2013 Target: Establish system service support at the collocation facility for Tier 3
applications and datasets.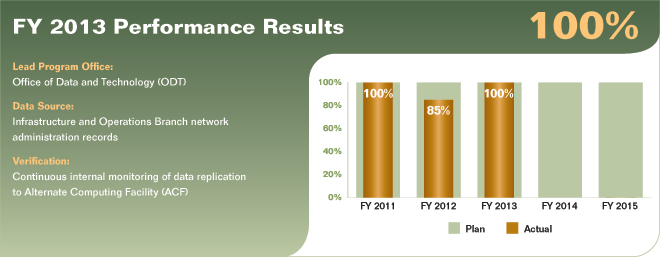
Performance Analysis & Review
The performance target was met for FY 2013. CFTC has mirrored applications and datasets for Tier3 to the collocated Alternate Computing Facility (ACF) and is in the process of performing testing and validation for those services and systems. System service support at the collocation facility for Tier 3 applications and datasets were established. Planned site-wide business continuity tests were successfully conducted in November 2013. Additional activities for the implementation of the IT strategy and architecture for Business Continuity (BC) planned for FY 2014 are on hold.
PERFORMANCE MEASURE 5.4.2.1 Implementation of enterprise data management for effective aggregation, correlation with external data, and increased collaboration with other regulators.
FY 2013 Target: Integrate TSS into enterprise data warehouse. Include swaps data
in enterprise data warehouse.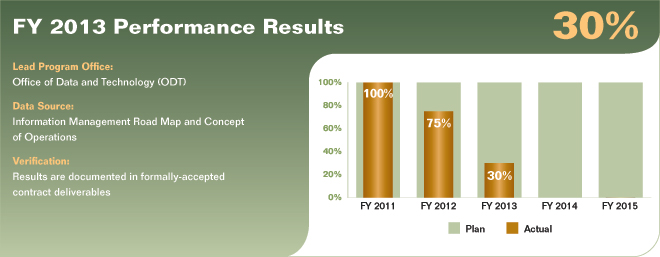
Performance Analysis & Review
The performance target was not met for FY 2013. Due to resource constraints, an Ownership Control Reporting (OCR) rule, on which integration of TSS data depends, was delayed for almost one year. The proposed OCR rule will integrate large trader position data with transaction data. Prior to OCR approval, the Commission has been successful in adding new data streams for swaps, but improving the quality of the data received from market participants will take longer than expected. The rule was approved by the Commission on November 18, 2013. The Commission will begin efforts to implement the OCR rule, but it will be at least 18 months before all data components needed to integrate transaction data (TSS) into the data warehouse are ready.
Not having OCR complete means that the Commission cannot efficiently associate large trader positions with the transaction data received from the exchanges. Furthermore, without the OCR data the Commission has insufficient account ownership information on positions and transactions. Without complete swaps data and the management of transaction and swaps data in a data warehouse, the Commission cannot aggregate futures and swaps positions efficiently. The risk to the public and to the market that this measure is not complete is that Commission staff will be less effective in monitoring traders, markets, and systemic risk.
PERFORMANCE MEASURE 5.4.2.2 Direct Access to SROs and SDRs for effective oversight.
FY 2013 Target: Receive and process swaps data pushed from existing SDRs.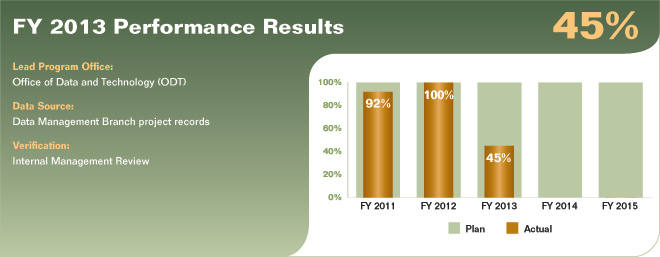
Performance Analysis & Review
The performance target was not met for FY 2013. The Commission is receiving limited sets of data from one SDR and conducting analysis to refine surveillance data requirements. In parallel, the Commission is leading a multi-phased collaborative effort with industry participants to refine and harmonize implementation of reporting data requirements across SDRs and to increase data quality. The Commission has also facilitated the successful establishment of interim Global Legal Entity Identifiers (Interim GLEIS) through the establishment and endorsement of the CFTC Interim Compliant Identifiers (CICI) to support the Commission Rules for Swaps data reporting and effective aggregation of swaps data.
The initiative is a high priority for the Commission. Accordingly, the Commission has attempted to mitigate as much as practical the effect of budgetary constraints. However, refinement of data standards and data quality improvements will continue using industry-wide collaboration and a phased, iterative approach, with prioritization based on oversight requirements.
Risk to the public and market due to the Commission’s continuing efforts to establish efficient aggregation processes is mitigated by staff ability to directly access Part 45 and 46 data on SDRs through SDR portals. However, staff will be able to conduct oversight more efficiently once data standards are fully refined, data consistency is uniform, and aggregation processes are well-established.
PERFORMANCE MEASURE 5.4.3.1 CFTC-wide document and records management and intranet solutions for improved data security collaboration, retention, sharing, and disposal.
FY 2013 Target: Implement automation of enterprise tips, complaints, and referral management. Implement Early Case Assessment System. Implement ERDM workflow and version control
(5 process groups).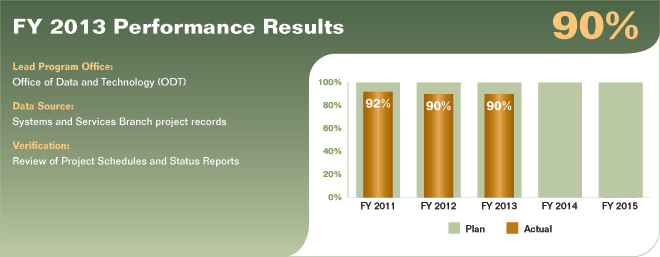
Performance Analysis & Review
The performance target was not met for FY 2013. CFTC is 100% complete with the implementation of tips, complaints, and referral management automation and 100% complete with the Implementation of Early Case Assessment (ECA). The Commission expanded use of ECA as a means to streamline the largest document productions for the Division of Enforcement. The Commission has procured and installed an enterprise Business Process Management System and implemented an Electronic Records and Data Management (ERDM) workflow and version control for one of the five planned process groups.
Only one of the five planned process group workflows was completed. All five planned process groups have been designed. Implementation of the remaining four planned process groups is scheduled to be completed by the end of the second quarter of FY 2014: Participant Submission, Publication, Examinations Document Request, and Change Control.
-
Goal Five performance measures, analysis and review – Objective 5.5
PERFORMANCE MEASURE 5.5.1.1 Reengineer, improve, and implement CFTC’s Cost Accounting Codes (BPAC).
FY 2013 Target: Improve and adapt business processes associated with cost accounting codes.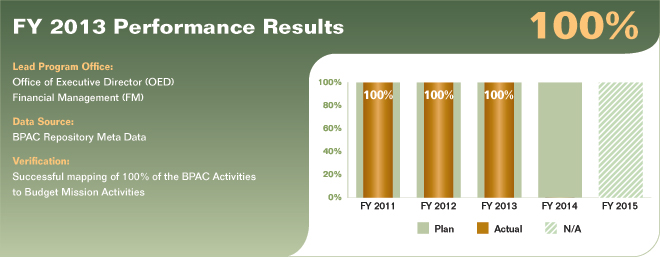
Performance Analysis & Review
The performance target was met for FY 2013. New Budget, Program, Activity Codes (BPAC) were developed in FY 2012 and implemented in October of FY 2013. The time and attendance process was the first to incorporate use of the new BPAC codes outside of the core financial system. This process was improved and standardized with the introduction of an automated agency-wide time and attendance template, which was distributed to and used by all CFTC employees until the WebTA system was implemented in July.
The other significant business processes associated with this measure, including the accurate reporting and collection of SRO fees and Statement of Net Costs, have been adapted to utilize the new BPAC codes. Implementing the new BPAC codes has simplified and increased the consistency and accuracy of the SRO fee and Statement of Net Costs processes.
PERFORMANCE MEASURE 5.5.2.1 Management Control Reviews are conducted and documented. Recommendations are implemented. The Chairman and the Chief Financial Officer (CFO) are able
to give an unqualified Federal Managers Financial Integrity Act (FMFIA) management assurances.
FY 2013 Target: Complete corrective action.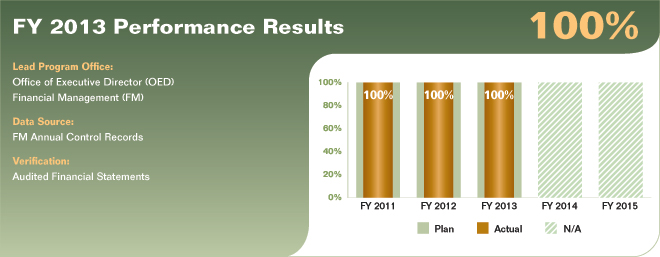
Performance Analysis & Review
The performance target was met for FY 2013. All corrective actions from the FY 2012 Financial Statement Audit have been taken. The Commission has no declared material weakness for FY 2013 and FY 2012 in the area of financial reporting that hinders preparation of timely and accurate financial statements. The CFTC also conducts reviews of its financial management systems in accordance with OMB Circular A-127, Financial Management Systems. Based on the results of these reviews, the CFTC can provide reasonable assurance that its financial management systems are in compliance with applicable provisions of the Federal Financial Management Improvement Act of 1996 as of September 30, 2013.
PERFORMANCE MEASURE 5.5.3.1 Implement web-based time and attendance system.
FY 2013 Target: Go live with WebTA.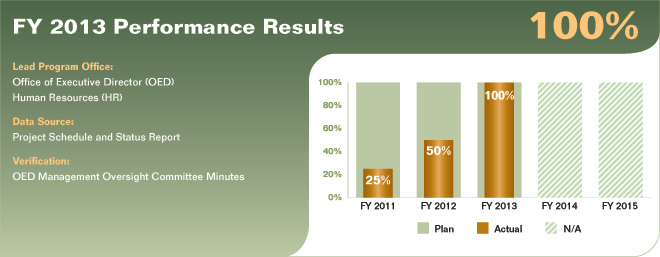
Performance Analysis & Review
The performance target was met for FY 2013. The Web Time and Attendance (WebTA) automated system was successfully implemented CFTC-wide on July 14, 2013 (Pay Period 14). This web-based system serves as a streamlined platform for staff to record their time and attendance directly for approval and submission to their supervisors and timekeepers. Implementation of this on-line portal has enhanced the effectiveness and efficiency of employees by reducing the staff time spent reporting on time and attendance. Use of this paper-less system, has increased the submission of time and attendance transmissions and significantly improved the accuracy of coding and capture of individual bi-weekly labor hours. In addition, the CFTC has been able to more quickly and accurately track time and attendance, analyze the distribution of labor and improve internal controls.
-
Other Information
Other Information presents supporting information regarding the CFTC FY 2013 Annual Performance Report. See below for details on the various sections, including the message from the Chief Planning Officer.
-
A Message from the Chief Planning Officer

I am pleased to present the CFTC’s FY 2013 Annual Performance Report. In the CFTC 2011 - 2015 Strategic Plan, 54 performance measures (now termed performance goals) were developed to determine program effectiveness. These measures and accomplishments were analyzed on a semi-annual basis and the full year is being reported in this Annual Performance Report (APR). The Commission’s organizational performance management activities continue to operate under the guidance of the GPRA Modernization Act of 2010 as an independent agency.
On the surface, having only met or exceeded 44% of the performance metrics is disappointing. However, as shown throughout this report much has been accomplished with very limited resources – priorities were chosen, staff was focused, and the swaps market was transformed. Critical market changing rules were drafted, finalized, and implemented. The Commission took unprecedented enforcement actions. The Commission achieved significant efficiencies through revised procedures and the use of information technology.
Looking forward
Assessing organizational performance and ensuring the best use of resources can be achieved using a number of different tools and methods, performance reporting being one of them. Equally important is a strategic vision grounded in leadership commitment to performance management.
In building the FY 2014 to FY 2018 Strategic Plan, the CFTC evaluated the effectiveness and usefulness of the current measures in conveying program accomplishment. While the Commission believes that in aggregate, the measures provide an accurate portrayal of progress, the Commission saw the opportunity to improve in a couple key areas. First, performance goals are most useful when each division or office director is held accountable for the goals and strategies. Evaluating goal performance twice a year meant that directors had little or no time to make course corrections if their programs were underperforming or reallocation of resources was warranted. Second, with an appropriate focus on outcome based measures, the CFTC had the opportunity to revise several production based measures. Finally, the Commission tied the performance goals to the broader strategic goals and objectives instead of individual strategies, which should be a better gauge of program success.
A top down approach was used to build the FY 2014 to FY 2018 performance goals. The first priority was to analyze each strategic goal and strategic objective to isolate key variables that indicate progress is being made. This is an especially difficult task as many of the goals and objectives are abstract in nature (e.g. measuring the susceptibility of markets to manipulation and other abusive practices). Accordingly, the CFTC developed multiple performance goals per strategic goal and in some cases per strategic objective. When viewed together, the Commission believes they will display true progress towards the goal.
The result is approximately 30 performance goals across the Commission, many of which are new. In FY 2014 and FY 2015, these will be base-lined with targets established in the Annual Performance Plan. The CFTC plans to monitor these goals on a quarterly or more frequent basis, providing better and more timely assessments of accomplishment to leadership, and providing division and office directors the opportunity to make adjustments where warranted.
The CFTC will seek greater accountability by developing annual operational plans. These operational plans tie the strategic goals and objectives to tactical requirements and will be approved by the Commission annually. The goals, objectives, and strategies will also be included in the annual performance evaluations of the office or division director or particular staff charged with implementing the goals, objectives, and strategies.
We appreciate the opportunity to report to the American public on the results of FY 2013 performance and look forward to any feedback we may receive on how we can improve our reporting in the future.

George Godding
Chief Planning Officer
Director, Business Management and Planning
February 2014 -
Completeness and Reliability of Performance Data
The Commission understands the ongoing importance of having appropriate controls in place to ensure the completeness and reliability of performance information. The CFTC views this process as an evolutionary one, with improvements developing as budget, time, and expertise will allow. In recent years, the CFTC developed and put into place a new strategic plan, providing an opportunity for how the Commission approaches the verification and validation of the performance measures within.
During FY 2012, the Strategic and Operational Planning team developed a comprehensive Performance Data Verification and Validation Checklist based on OMB guidance [Circular A-11 (2012)]. The checklist was shared with appropriate division and office staff as a structured method of self-evaluation with regards to the controls to be in place when collecting and reporting performance information. It can be used as a tool for each division and office to assess their level of internal controls as it pertains to performance information.
While developing the 2014-2018 Strategic Plan in FY 2013, the CFTC continues to build completeness and reliability into the performance goals. The significant change in the new strategic plan is the development of a performance goal dictionary, which further defines the performance goals; describes offices of primary and secondary responsibility; provides detailed justifications explaining how the performance goals measure progress towards the overall strategic objectives; lists all data sources; provides verification and validation of data and data sources; and finally, provides detailed methodologies on how to build the performance goals. The dictionary serves as a key internal control document for performance goals and, if used properly, will provide continuity and consistency in data collection and analysis.
-
Program Evaluations
The Office of the Inspector General (OIG) conducts and supervises audits and investigations of programs and operations of the CFTC and recommends policies to promote economy, efficiency, and effectiveness in CFTC programs and operations and to prevent and detect fraud and abuse. The OIG conducted a FY 2013 assessment addressing the Commission’s most serious management issues. The OIG’s assessment is located in the Other Information section of the FY 2013 Agency Financial Report (AFR) and on the Commission website at http://www.cftc.gov/ucm/groups/public/@aboutcftc/documents/file/2013afr.pdf.
-
Acknowledgements
This Annual Performance Report was produced by the contributions of dedicated and talented Commission staff. To these individuals, the Business Management and Planning Branch would like to offer a genuine thank you and acknowledge our true appreciation for their effort.
Stephanie Allen
Kristin Andrews
Srini Bangarbale
Rachel Berdansky
Thomas Bloom
Mark Bullard
Eileen Chotiner
Angela Clark
Ken Danger
Phyllis Dietz
Alison Edelstein
Melissa Ferguson
Frank Fisanich
Jennifer Fleming
Richard Foelber
Tomeka Gilbert
Barbara Gold
Jerry Golley
Christopher Goodenow
Monica Green
Steve Greska
Ward Griffin
Robin Hagedorn
Melissa Hendrickson
Harry Hild
Andy Hinz
Matthew Hunter
Keith Ingram
Luis James
Sarah Josephson
John Lawton
Tom Leahy
Laurie Lindsay
Margaret Littlejohn
Alice Macklin
Nancy Markowitz
Scott Mixon
Julie Mohr
Brian O’Keefe
Alison Orchant
Jim Outen
Elizabeth Padgett
Tina Paulsen
Kevin Piccoli
Andrew Pugh
Sebastian Pujol
Robert Rosenfeld
Christopher Russell-Wood
Myra Silberstein
Patricia Smith
Thomas Smith
Jeffrey Vargas
Megan Wallace
Robert Wasserman
Ralph White
-
Glossary of Abbreviations and Acronyms
The CFTC Glossary
A Guide to the Language of the Futures Industryhttp://www.cftc.gov/ConsumerProtection/EducationCenter/CFTCGlossary/index.htm
The Glossary of Acronyms for this report is intended to assist the public in understanding some of the specialized words and phrases used in the futures industry since many of these terms are not found in standard reference works. This glossary is not inclusive, and if you cannot find the term you are looking for or have any other comments, please let us know at [email protected].
Definitions are not intended to state or suggest the views of the Commission concerning the legal significance or meaning of any word or term and no definition is intended to state or suggest the Commission’s views concerning any trading strategy or economic theory.
Glossary of Acronyms
U.S. Federal Law
- CEA
- Commodity Exchange Act of 1936
- CFR
- Code of Federal Regulations
- Dodd-Frank Act
- Dodd-Frank Wall Street Reform and Consumer Protection Act of 2010
- FMFIA
- Federal Managers’ Financial Integrity Act
CFTC Divisions and Offices
- DCR
- Division of Clearing and Risk
- DMO
- Division of Market Oversight
- DOE
- Division of Enforcement
- DSIO
- Division of Swap Dealer and Intermediary Oversight
- OCE
- Office of the Chief Economist
- ODT
- Office of Data and Technology
- OED
- Office of the Executive Director
- OGC
- Office of the General Counsel
- OIA
- Office of International Affairs
- OIG
- Office of the Inspector General
- OITS
- Office of Information Technology Services
- WBO
- Whistleblower Office
U.S. Federal Departments and Agencies
- CFTC
- U.S. Commodity Futures Trading Commission
- GAO
- U.S. Government Accountability Office
- NARA
- National Archives and Records Administration
- OFR
- Office of Financial Research
- OMB
- Office of Management and Budget
- SEC
- U.S. Securities and Exchange Commission
- USDA
- U.S. Department of Agriculture
Other Abbreviations
- ACF
- Alternate Computing Facility
- AFR
- Agency Financial Report
- APR
- Annual Performance Report
- BPAC
- Budget Program Activity Code
- BSM
- Bovespa Market Supervision
- CBOT
- Chicago Board of Trade
- CDS
- Credit Default Swap
- CFO
- Chief Financial Officer
- CICI
- CFTC Interim Compliant Identifiers
- CME
- Chicago Mercantile Exchange
- CSRC
- China Securities Regulatory Commission
- DCE
- Designated Clearing Entity
- DCM
- Designated Contract Market
- DCO
- Derivatives Clearing Organization
- ECA
- Early Case Assessment
- EFRP
- Exchange of Futures for Related Product
- ERDM
- Electronic Records and Data Management
- EVS
- Employee Viewpoint Survey
- FBOT
- Foreign Board of Trade
- FCM
- Futures Commission Merchant
- FINRA
- Financial Industry Regulatory Authority
- FOREX
- Foreign Exchange Currency
- FSA
- Financial Services Authority
- FSB
- Financial Stability Board
- FY
- Fiscal Year
- GLEIS
- Global Legal Entity Identifiers
- IOSCO
- International Organization of Securities Commissions
- ISS
- Integrated Surveillance System
- IT
- Information Technology
- LEI
- Legal Entity Identifier
- LIBOR
- London Interbank Offered Rate
- MSP
- Major Swap Participant
- MOU
- Memoranda of Understanding
- NFA
- National Futures Association
- OCR
- Ownership Control Reporting
- OTC
- Over-the-Counter
- RER
- Rule Enforcement Review
- RFA
- Registered Futures Association
- RFED
- Retail Foreign Exchange Dealer
- RSR
- Regulatory Statement Review
- SAAS
- Software-as-a-Service
- SD
- Swap Dealer
- SDR
- Swap Data Repository
- SEF
- Swap Execution Facility
- SIDCO
- Systemically Important Derivatives Clearing Organization
- SPARK
- Stressing Positions at Risk
- SPFI
- Summary of Performance and Financial Information
- SRO
- Self-Regulatory Organization
- WebTA
- Web Time and Attendance System
-
Enforcement Actions
The Commission announced that it filed 82 enforcement actions in fiscal year 2013 (FY 2013), bringing the total over the past three fiscal years to 283, nearly double the number of actions brought during the prior three fiscal years. In addition, the Division of Enforcement (Division) obtained orders this year imposing more than $1.7 billion in sanctions, including orders for more than $1.5 billion in civil monetary penalties and more than $200 million in restitution and disgorgement. This year’s civil monetary penalties total more than seven times the Commission’s operating budget for the fiscal year. The Division also reported that it opened more than 290 new investigations in FY 2013, adding to the numerous investigations previously opened. The Division noted that while the number of actions filed is among the highest annual figures in program history, that total is down compared to FY 2012.
“We measure success principally by the impact of our cases: positively influencing market behavior, penalizing and deterring illegal conduct, and requiring orders of restitution for victim losses,” said David Meister, the Enforcement Division’s Director. “As we have begun to enforce our new Dodd-Frank authority on top of the laws that have been on the books for decades, the cases we bring and the sanctions we have obtained reflect the Division’s unwavering commitment to protect market participants and promote market integrity. On a personal note, as I will be departing the CFTC later this month, I want to thank the Enforcement staff for giving me their support over the past nearly three years – it has been an honor and a privilege to lead such a dedicated team of public servants.”
Highlights of Selected FY 2013 CFTC Enforcement Actions:
LIBOR and other Interest Rate Benchmarks
- The Commission simultaneously filed and settled charges against UBS, finding that it engaged in manipulation, attempted manipulation and false reporting of LIBOR and other benchmark interest rates for at least six years. The Commission found that UBS engaged in more than 2,000 instances of unlawful conduct involving dozens of employees on several continents, including colluding with other banks; inducing interdealer brokers to spread false information and influence other banks; and making false LIBOR submissions to protect UBS’s reputation during the global financial crisis. The Commission ordered UBS to pay a $700 million civil monetary penalty. In re UBS AG, et al., CFTC Docket No. 13-09 (CFTC filed Dec. 19, 2012), Press Release 6472-12.
- The Commission simultaneously filed and settled charges against The Royal Bank of Scotland plc. and RBS Securities Japan Limited, finding that they engaged in manipulation, attempted manipulation, and false reporting relating to LIBOR for Yen and Swiss Franc for approximately four years, as recently as 2010 and dating back to at least mid-2006. The Commission ordered RBS to pay a $325 million civil monetary penalty. In re The Royal Bank of Scotland plc., et al., CFTC Docket No. 13-14 (CFTC filed Feb. 6, 2013), Press Release 6510-13.
- The Commission simultaneously filed and settled charges against ICAP Europe Limited (ICAP), an interdealer broker, finding that for more than four years, from at least October 2006 through at least January 2011, ICAP engaged in manipulation, attempted manipulation, false reporting, and aiding and abetting derivatives traders’ manipulation and attempted manipulation, relating to the LIBOR for Yen. The Commission ordered ICAP to pay a $65 million civil monetary penalty. In re ICAP Europe Ltd., CFTC Docket NO. 13-38 (CFTC Filed Sept. 25, 2013), Press Release 6708-13.
- Taking these FY 2013 actions together with the action against Barclays Bank in FY 2012 (Press Release 6289-12), the CFTC’s benchmark-related cases have yielded total penalties of just under $1.3 billion.
Protection of Customer Funds (MF Global, Peregrine and Others)
- The Commission filed charges in federal court against MF Global Inc., MF Global Holdings Ltd., former Chief Executive Officer Jon S. Corzine, and former Assistant Treasurer of MF Global Edith O’Brien alleging, among other violations, MF Global’ s unlawful use of customer funds that harmed thousands of customers and violated fundamental customer protection laws on an unprecedented scale. MF Global agreed to settle all charges against it on terms set forth in a proposed order that is subject to court approval and includes 100% restitution of the approximately $1 billion lost by all commodity customers when the firm failed on October 31, 2011. CFTC v. MF Global Inc., et al., No. 13 CIV 4463 (S.D.N.Y. filed June 27, 2013), Press Release 6626-13.
- The Commission obtained federal court orders against Peregrine Financial Group, Inc. (PFG), and its owner, Russell Wasendorf, Sr., finding that they misappropriated in excess of $200 million of customer funds, violated customer fund segregation requirements and made false statements to the CFTC. The Court enjoined further violations and ordered trading and registration bans, while reserving for future consideration the issues of a civil monetary penalty for both PFG and Wasendorf and restitution from Wasendorf. CFTC v. Peregrine Financial Group, Inc., et al., No. 1:12-cv-05383, Default Judgment (N.D. IL. entered Feb. 13, 2013), Press Release 6300-12 (regarding the Commission’s filing of an enforcement action on July 10, 2012).
- The Commission simultaneously filed and settled charges against PFG’s longtime auditor, Jeannie Veraja-Snelling, a sole practitioner certified public accountant (CPA), finding that her audits were not performed in accordance with GAAS and did not include appropriate review and tests of internal accounting controls and procedures for safeguarding customer assets, as required by CFTC Regulations. The Commission permanently barred Veraja-Snelling from appearing or practicing as an accountant before the Commission. In re Veraja-Snelling, CFTC Docket No. 13-29 (CFTC filed Aug. 26, 2013), Press Release 6675-13.
- The Commission filed charges in federal court against U.S. Bank National Association for unlawfully using and holding PFG customer segregated funds. According to the complaint, U.S. Bank, among other things, (i) unlawfully accepted Peregrine’s customers’ funds as security on loans it made to Wasendorf, his wife and his construction company; and (ii) knowingly facilitated Wasendorf’s transfers of millions of dollars of customers’ funds to pay for Wasendorf’s private jet, his restaurant, and his divorce settlement. CFTC v. U.S. Bank, NA, No. 13–Civ–2041–EJM (N.D. Iowa filed June 5, 2013), Press Release 6601-13.
- The Commission filed charges in federal court against the accounting firm Tunney & Associates, P.C. related to its audits for a registered FCM. According to the complaint, neither Tunney & Associates nor its owner CPA, Michael Tunney, had experience auditing FCMs or any entity that holds customer segregated accounts, nor did they have an understanding of the applicable Commodity Exchange Act or CFTC regulatory provisions prior to accepting the audit engagements. CFTC v. Tunney & Associates, P.C., et al., No. 1:13-cv-02919 (N.D. Ill. filed Apr. 18, 2013), Press Release 6571-13.
- The Commission simultaneously filed and settled 14 actions against FCMs alleging violations of customer segregation, secured, and net capital rules and/or related supervision failures, and obtained over $5.5 million in civil monetary penalties, including: In re ABN AMRO Clearing Chicago LLC, CFTC Docket No. 13-25 (CFTC filed June 18, 2013) (Press Release 6614-13; ABN AMRO failed to segregate or secure sufficient customer funds, meet minimum net capital requirements, maintain accurate books and records, and supervise its employees; $1 million civil monetary penalty); and In re Cantor Fitzgerald & Co, Inc., CFTC Docket No. 13-06 (CFTC filed Nov. 21, 2012) (Press Release 6419-12; Cantor failed to maintain sufficient funds in its customer segregation account for a period of three days and failed to provide the CFTC timely notice of its under-segregation, as required; $700,000 civil monetary penalty).
- The Commission also settled federal charges previously filed against MBF Clearing Corp. alleging that from September 2008 through March 2010, MBF routinely held between $30 million and $90 million of its customer funds in an account at another financial institution, but that account was not legally qualified to hold customer segregated funds. MBF paid a $650,000 civil monetary penalty. CFTC v. MBF Clearing Corp., No. 1:12-cv-01830-SAS, Consent Order (S.D.N.Y. entered Nov. 28, 2012), Press Release 6437-12.
Other Manipulation and Trading Violations; Pre- and Post-Dodd Frank Authority
- The Commission filed charges in federal court against Eric Moncada, BES Capital LLC, and Serdika LLC alleging that they attempted to manipulate wheat futures prices, and engaged in fictitious sales and non-competitive transactions. According to the complaint, Moncada entered and immediately canceled numerous large-lot orders for wheat futures that he did not intend to fill, intending to create a misleading impression of increasing liquidity in the marketplace. Moncada allegedly would then seek to take advantage of any price movements that may have resulted from this manipulative scheme by placing smaller orders, which he hoped to fill at beneficial prices, on the opposite side of market from his large-lot cancelled orders. CFTC v. Moncada, et al., No. 12-cv-8791 (S.D.N.Y. filed Dec. 4, 2012), Press Release 6441-12.
- In the first case under Dodd-Frank Act’s spoofing prohibition (bidding or offering with intent to cancel before execution), the Commission simultaneously filed and settled charges against Panther Energy Trading LLC and Michael J. Coscia. Per the Order, Defendants utilized a computer algorithm designed to illegally place and quickly cancel large bids and offers in futures contracts on CME Group’s Globex trading platform. These orders gave the impression of significant trading interest, which Defendants exploited. The Commission ordered Panther and Coscia to pay a $1.4 million civil monetary penalty, and disgorge $1.4 million in trading profits. In re Panther Energy Trading LLC, et al., No. 13-26 (CFTC filed July 22, 2013), Press Release 6649-13.
- The Commission simultaneously filed and settled two related enforcement actions finding that: Gelber Group, LLC (Gelber), an FCM, reported orders during the pre-opening trading sessions it had no intention of executing; and Gelber and former Gelber trading manager, Martin A. Lorenzen, engaged in wash sales. In re Gelber Group, LLC, CFTC Docket No. 13-15 (CFTC filed Feb. 8, 2013) (ordering a $750,000 civil monetary penalty); In re Lorenzen, CFTC Docket No. 13-16 (CFTC filed Feb. 8, 2013) (ordering a $250,000 civil monetary penalty), Press Release 6512-13.
Designated Contract Market Violations
- The Commission filed charges in federal court against the New York Mercantile Exchange, Inc. (CME NYMEX), which is owned and operated by the CME Group, and two former CME NYMEX employees, William Byrnes and Christopher Curtin, alleging that they unlawfully repeatedly disclosed material nonpublic customer information over two and a half years to an outside commodity broker who was not authorized to receive the information. CFTC v. Byrnes, et al., No. 13 CIV 1174 (S.D.N.Y. filed Feb. 21, 2013), Press Release 6519-13, and Press Release 6584-13 (regarding amended complaint to charge Ron Eibschutz, who received the confidential information, with aiding and abetting the violations).
Futures Commission Merchant and Introducing Broker Supervision Violations
- The Commission simultaneously filed and settled charges against FXDirectDealer, LLC (FXDD), a registered RFED and FCM, finding that from at least December 10, 2009, until June 2011, it violated its supervision obligations by employing a trading system that gave FXDD pricing advantages over and harmed thousands of its retail customers. The Commission ordered FXDD to make full restitution of $1,828,261 to FXDD’s current and former customers that were harmed by its violation and imposed a $914,131 civil monetary penalty. In re FXDirectDealer, LLC, CFTC Docket No. 13-34 (CFTC filed Sept. 18, 2013), Press Release 6697-13.
- The Commission simultaneously filed and settled charges against FCStone LLC, an FCM, finding that it failed to implement adequate customer credit and concentration risk policies and controls in 2008 and part of 2009, allowing one account to acquire a massive options position that the account owners could not afford to maintain. FCStone, which was ultimately obligated to take over the account in question, lost approximately $127 million. The Commission ordered FCStone to pay a civil monetary penalty of $1.5 million. In re FCStone, LLC, CFTC Docket No. 13-24 (CFTC filed May 29, 2013), Press Release 6594-13.
- The Commission simultaneously filed and settled charges against Goldman, Sachs & Co. finding that it failed to supervise diligently its employees for several months in late 2007 when a then-Goldman trader was able to conceal an $8.3 billion trading position from the firm. The Commission ordered Goldman to pay a $1.5 million civil monetary penalty. In re Goldman Sachs & Co., CFTC Docket No. 13-08 (CFTC Dec. 7, 2012), Press Release 6450-12, and Press Release 6677-13 (regarding settlement by former Goldman employee Matthew Marshall Taylor for defrauding Goldman by intentionally concealing from Goldman the true position size, as well as the risk and potential profits or losses associated with a futures position in a firm account traded by him; CFTC v. Taylor, No. 1:12-cv-8170-RJS, Consent Order (S.D.N.Y. filed Aug. 29, 2013) (imposing $500,000 civil monetary penalty)).
- The Commission simultaneously filed and settled charges against Foremost Trading LLC, an IB, finding that the firm failed to diligently supervise the handling of accounts held by clients that were referred to Foremost from three unregistered entities that sold futures trading systems (the Systems Providers). Foremost’s officers, employees, and agents ignored warning signs that the Systems Providers were procuring their clients through fraudulent means and engaging in fraudulent business practices. The Commission ordered Foremost to pay a $400,000 civil monetary penalty. In re Foremost Trading LLC, CFTC Docket No. 13-35 (CFTC filed Sep. 20, 2013), Press Release 6700-13.
False Statements under Dodd-Frank
- The Commission used new Dodd-Frank authority prohibiting the making of false and misleading statements. The Commission filed and settled charges against a defendant who gave false testimony in a Division investigation, imposing a $50,000 penalty on the defendant. In re Butterfield, CFTC Docket No. 13-33 (CFTC filed Sept. 16, 2013), Press Release 6693-13.
- The Commission filed charges in federal court against Arista LLC and its principals, Abdul Sultan Walji (a/k/a Abdul Sultan Valji) and Reniero Francisco (who had previously been charged with fraud), alleging that the defendants misrepresented certain information in a letter sent to the CFTC’s Division of Enforcement during the course of an investigation. CFTC v. Arista LLC, et al., 12-CV-9043 (SDNY amended complaint filed May 28, 2013), Press Release 6600-13.
- The Commission also used this new authority in its Peregrine enforcement action to charge the defendants for filing false statements on required forms with the Commission. See above, Protection of Customer Funds (MF Global, Peregrine and Others).
Precious Metals Fraud Charges under Dodd-Frank
- Under the Dodd-Frank Act and implementing regulations, the Commission filed charges in federal court against Hunter Wise Commodities, LLC, and related entities, charging them with fraudulently marketing illegal, off-exchange retail commodity contracts involving physical metals, including gold, silver, platinum, palladium, and copper. The complaint alleges that Hunter Wise Commodities, the orchestrator of the fraud, has taken in at least $46 million in customer funds since July 2011. CFTC v. Hunter Wise Commodities, LLC, et al., No. 12-cv-81311 (S.D. Fla. filed Dec. 5, 2012), Press Release 6447-12.
- The Commission also filed and settled actions against 9 firms and 8 individuals who solicited retail customers to invest in financed precious metals transactions, which were executed through Hunter Wise, alleging that the firms were engaging in illegal, off-exchange precious metals transactions and requiring the firms and their principals to pay more than $4.1 million in restitution. See In re Secured Precious Metals Int’l, Inc., et al., CFTC Docket No. 13-12 (CFTC filed Jan. 28, 2013) (Press Release 6503-13; imposing a cease and desist order and five-year trading ban); In re Barclay Metals, Inc., et al., CFTC Docket No. 13-13 (CFTC Jan. 28, 2013) (same); In re Joseph Glenn Commodities, LLC, et al., CFTC Docket No. 13-18 (CFTC filed Mar. 27, 2013) (Press Release 6542-13; ordering defendants to pay approximately $635,000 in restitution and to return approximately $330,000 remaining in customers’ accounts, and requiring one of the principals to pay a civil monetary penalty of $100,000); In re Pan American Metals of Miami, LLC, et al., CFTC Docket No. 13-27 (CFTC filed July 29, 2013) (Press Release 6653-13; ordering defendants to jointly pay restitution of approximately $3.2 million and a $1.5 million civil monetary penalty); In re London Metals Market, LLC, et al., CFTC Docket No. 13-32 (CFTC filed Sept. 4, 2013) (Press Release 6680-13; ordering defendants to pay $121,665.75 in restitution); In re Hall, CFTC Docket No. 13-32 (CFTC filed Sept. 4, 2013) (Press Release 6681-13; ordering Hall to pay $202,577 in restitution).
- The Commission also brought actions against other firms that purported to directly deal in precious metal. See CFTC v. Global Precious Metals, LLC, et al., No. 13-cv-21708, Default Judgment (S.D. Fla. entered Aug. 12, 2013) (Press Release 6670-13; defendants ordered to pay a $1.26 million civil monetary penalty, $736,979 in restitution, and to disgorge $186,860 in ill-gotten gains); CFTC v. AmeriFirst Management LLC, et al., No. 13-cv-61637 (S.D. Fla. filed July 29. 2013) (Press Release 6655-13; Division charges defendants with operating a precious metals scheme marketing illegal, off-exchange financed commodity transactions, claiming that they operated through a network of more than 30 dealers, and fraudulently misrepresenting the nature of those transactions); and CFTC v. Worth Group, Inc., et al., No. 13-cv-80796 (S.D. Fla. filed Aug. 13, 2013) (Press Release 6666-13; Worth is alleged to have taken in over $73 million from hundreds of retail customers located throughout the United States).
- The Commission settled previously filed charges against Ronnie Gene Wilson and his company, Atlantic Bullion & Coin, Inc. (Atlantic Bullion), alleging that they defrauded investors in connection with a multi-million dollar silver bullion Ponzi scheme. The June 6, 2012 complaint charged defendants under new Dodd-Frank Act anti-fraud prohibition in connection with a contract of sale of a commodity in interstate commerce. Wilson was ordered to pay a $23 million civil monetary penalty and $11,530,000 of restitution (and in a parallel criminal case, sentenced to 235 months’ imprisonment). CFTC v. Atlantic Bullion & Coin, Inc., et al., No. 8:12-cv-01503-JMC, Consent Order (D.S.C. filed Feb. 27, 2013), Press Release 6524-13.
Ponzi Fraud – Trial Victory
- On April 24, 2013, following a bench trial, the U.S. District Court for the Southern District of Florida ordered William Center to pay restitution of $455,430 individually and $8,652,140.41 jointly and severally with Trade, LLC, as well as a $4 million civil monetary penalty; and Gregory Center to pay $265,661 restitution and a $2 million civil monetary penalty. The Commission filed charges against the defendants on June 22, 2010 (Press Release 5848-10) alleging that they operated a Ponzi scheme. CFTC v. Milton, et al., No. 9:10-cv-80738-DTKH, Memorandum Opinion (S.D. Fla. May 17, 2013), Press Release 6593-13.
“Prediction Market” Off-Exchange Options Trading
- The Commission filed charges in federal court against Intrade The Prediction Market Limited and Trade Exchange Network Limited (TEN), companies based in Dublin, Ireland, with offering prohibited off-exchange commodity option contracts to U.S. customers by operating an online “prediction market” trading website, through which customers buy or sell binary options that allow them to predict (“yes” or “no”) whether a specific future event will occur. The Commission also alleged that defendants made false statements to the Commission about their website and that TEN violated a 2005 CFTC cease and desist order (Press Release 5124-05). CFTC v. Trade Exchange Network Limited, No. 1:12-cv-01902 (D.D.C. Nov. 26, 2012), Press Release 6423-12.
- The Commission filed charges in federal court against Banc de Binary, Ltd., a foreign company, alleging that it operated an unregistered FCM and, from May 2011 through March 2013, operated an online trading website that allowed U.S. customers to trade options products prohibited by the CFTC’s ban on off-exchange options trading. CFTC v. Banc De Binary LTD, No. 2:13-cv-00992 (D. Nev. filed June 5, 2013), Press Release 6602-13.
Cooperation with Law Enforcement Partners
- The Division of Enforcement worked actively with federal and state criminal and civil law enforcement authorities, including by sharing information in just under 300 investigations and prosecutions, which is reflective of the high priority that the CFTC places on supporting criminal prosecution of willful violations of the commodities laws. Approximately 93% of the CFTC’s major fraud cases filed during FY 2013 involved a parallel criminal proceeding, with violators sentenced up to 50 years’ imprisonment.
CFTC Performance Measures and Results
CFTC Performance Measures and Results presents a tabular summary of measures and results for Objective 0.1 and the five Strategic Goals, followed by a table that includes those performance measures that were rule-dependent (Dodd-Frank Act) and others “Not Applicable” during FY 2013. See below for summaries by goal followed by a summary of those measures not applicable in FY 2013.
-
Objective 0.1 Measure and Results
Objective 0.1 CFTC Performance Measure and Results Goal.Objective.Strategy.Measure
Performance MeasureFY 2011
ActualFY 2012
ActualFY 2013
ActualFY 2013
PlannedFY 2014
PlannedFY 2015
Planned0.1.1.1
Complete all Dodd-Frank Act rules within statutory time frames.18% 82% 86% 100% N/A N/A -
Goal One: Protect the public and market participants by ensuring market integrity, promoting transparency, competition and fairness and lowering risk in the system.
Goal One CFTC Performance Measures and Results Goal.Objective.Strategy.Measure
Performance MeasureFY 2011
ActualFY 2012
ActualFY 2013
ActualFY 2013
PlannedFY 2014
PlannedFY 2015
Planned1.1.1.2
Implement automated surveillance alerts and a case management system.70%
Implement four automated market alerts.100%
Implement automated market profile alerts. Integrate swaps market data into two automated market alerts.0%
Implement automated market profile alerts for swaps market.100%
Implement automated market profile alerts for swaps market.N/A
N/AN/A
N/A1.1.1.3
Implement automated trading violation alerts and a case management system.20%
Implement five automated trading violation alerts.98%
Implement five automated trading violation alerts.95%
Implement four automated trading violation alerts.100%
Implement four automated trading violation alerts.100%
Implement two automated trading violation alerts.100%
Develop and implement additional automated alerts as identified.1.1.4.1
Percentage of contracts that are reviewed, in a timely manner, following a finding of market significance, and determined to be in compliance with core principles or referred back to exchange for modification.2% 10% 4% 100% 100% 100% 1.1.5.1
Rule submissions are reviewed and a determination is made regarding compliance with the CEA, or referred back to the exchange for correction, as amended by the Dodd-Frank Act and Commission regulations within the required 10-day or 90-day time period.77% 73% 100% 100% 100% 100% 1.1.6.1
DCM and SEF applications are reviewed and a determination is made regarding compliance with core principles within statutory time frames.100% 100% 100% 100% 100% 100% 1.2.1.1
Percentage of major DCMs and SEFs reviewed, during the year. (Structural Sufficiency)40% 0% 60% 100% 100% 100% 1.2.1.2
Percentage of non-major DCMs and SEFs reviewed, during the year. (Structural Sufficiency)20% 13% 25% 100% 100% 100% 1.2.2.1
Percentage of major DCMs and SEFs reviewed, during the year. (Automated Systems and Business Continuity)80% 80% 20% 100% 100% 100% 1.2.2.2
Percentage of non-major DCMs and SEFs reviewed, during the year. (Automated Systems and Business Continuity)0% 0% 16% 33% 33% 33% 1.3.1.1
Publish reports for swaps markets activity.N/A
N/A100%
Develop and test aggregation methods to group interest rate swap products.70%
Develop and test aggregation methods to group all commodity swap products under CFTC position limits. Publish swaps market report for interest rate swap products. Publish Dodd-Frank Act required semiannual and annual swaps reports for all interest rate swap products.100%
Develop and test aggregation methods to group all commodity swap products under CFTC position limits. Publish swaps market report for interest rate swap products. Publish Dodd-Frank Act required semiannual and annual swaps reports for all interest rate swap products.100%
Develop and test aggregation methods to group currency, equity, credit and other commodity swap products. Publish swaps market reports for all commodity swap products under CFTC position limits. Publish Dodd-Frank Act required semiannual and annual swaps reports for all commodity swap products under CFTC position limits.100%
Publish swaps market reports for currency, equity and other commodity swap products. Publish Dodd-Frank Act required semiannual and annual swaps reports for currency, equity and other commodity swap products. -
Goal Two: Protect the public and market participants by ensuring the financial integrity of derivatives transactions, mitigation of systemic risk, and the fitness and soundness of intermediaries and other registrants.
Goal Two CFTC Performance Measures and Results Goal.Objective.Strategy.Measure
Performance MeasureFY 2011
ActualFY 2012
ActualFY 2013
ActualFY 2013
PlannedFY 2014
PlannedFY 2015
Planned2.1.1.1
Review systemically important DCOs annually. Percentage of SIDCOs reviewed.75% 50% 100% 100% 100% 100% 2.1.1.2
On a risk-based basis, review all other DCOs annually to assess compliance with DCO core principles and Commission requirements.44% 30% 23% 100% 100% 100% 2.1.1.3
Percent of requests for Commission orders that are completed following review under the applicable provisions of the CEA.0% 64% 73% 94% 96% 98% 2.1.2.1
Applications are reviewed and a determination made regarding compliance with financial integrity provisions of the CEA within statutory time frames. Percent in compliance with financial integrity provisions.100% N/A 100% 100% 100% 100% 2.1.3.1
All material exceptions in monthly and annual financial filings by FCMs and RFEDs and notices of noncompliance with respect to minimum capital and segregation are reviewed and assessed within one business day. Percent completed within one business day.100% 100% 100% 100% 100% 100% 2.1.3.2
On a risk-based basis, conduct direct examinations of FCMs and RFEDs, identify deficiencies, and confirm that all deficiencies identified are corrected within the specified period of time. Percent corrected within specified time period.100% 55% 76% 94% 96% 98% 2.1.4.1
Reviews of swaps submitted to the Commission are completed within statutory and regulatory deadlines.N/A 50% 75% 100% 100% 100% 2.1.5.1
Reviews of DCO rules submitted to the Commission are completed within statutory and regulatory deadlines.100% 100% 100% 100% 100% 100% 2.1.6.1
Perform risk analysis and stress-testing on large trader and clearing member positions to ascertain those with significant risk and confirm that such risks are being appropriately managed. Number of positions analyzed.500,000 550,000 625,000 600,000 650,000 700,000 2.1.6.2
On a risk-based basis, meet with large traders, FCMs, SDs, and other industry participants to discuss risk management issues. Number of entities met with and risk issues reviewed.110 110 106 132 143 154 2.2.2.1
Under a risk-based approach, conduct reviews of selected programs of all RFAs to assess fulfillment of statutory and delegated responsibilities and confirm that any deficiencies identified are corrected within the specified period of time. Percent of deficiencies corrected within specified time period.0% 80% 0% 94% 96% 98% 2.2.2.2
Percentage of RFA rules submitted for which determinations are made within statutory time frames.100% 80% 100% 94% 96% 98% 2.2.3.1
On a risk-based basis, conduct direct examinations of non-FCM intermediaries, identify deficiencies, and confirm that any deficiencies identified are corrected within the specified period of time. Percent of time that deficiencies are corrected within specified time period.0% 0% 0% 94% 96% 98% 2.3.1.1
On a risk-based basis, review all SROs annually to assess compliance with CEA and Commission requirements, identify deficiencies, and confirm that any deficiencies identified are corrected within the specified period of time. Percent of time in which deficiencies are corrected within specified time period.80% 80% 75% 94% 96% 98% 2.3.1.2
Percentage of direct examinations of registered intermediaries that confirm proper execution of SRO programs.100% 43% 100% 94% 96% 98% 2.4.1.1
Program redesign to cover new registrants monitored by the RSR and SPARK systems. Percentage of system redesign accomplished.80% 80% 95% 95% 98% 100% 2.4.1.2
Program design to cover new data collection requirements to monitor systemic risk posed by CPOs and CTAs advising private funds, and new registration of swap dealers. Percentage of system redesign accomplished.N/A N/A 10% 95% 98% 100% -
Goal Three: Protect the public and market participants through a robust enforcement program.
Goal Three CFTC Performance Measures and Results Goal.Objective.Strategy.Measure
Performance MeasureFY 2011
ActualFY 2012
ActualFY 2013
ActualFY 2013
PlannedFY 2014
PlannedFY 2015
Planned3.1.1.1
Percentage of enforcement investigations concluded within one year of opening.81% 69% 62% 75% 75% 80% 3.2.1.1
Percentage of CFTC case filings that include referrals to domestic civil and criminal cooperative authorities.62% 91% 93% 70% 75% 75% -
Goal Four: Enhance integrity of U.S. markets by engaging in cross-border cooperation, promoting strong international regulatory standards, and encouraging ongoing convergence of laws and regulation worldwide.
Goal Four CFTC Performance Measures and Results Goal.Objective.Strategy.Measure
Performance MeasureFY 2011
ActualFY 2012
ActualFY 2013
ActualFY 2013
PlannedFY 2014
PlannedFY 2015
Planned4.1.1.1
Days allotted for acknowledgment of incoming requests for enforcement assistance from our international counterparts pursuant to our information sharing arrangements.1 3 8 3 2 2 4.2.1.1
Number of international regulatory and standard-setting working groups in which the Commission participates.12 15 18 9 9 9 4.3.1.1
Number of non-U.S. regulators trained.225 414 401 200 225 225 -
Goal Five: Promote Commission excellence through executive direction and leadership, organizational and individual performance management, and effective management of resources.
Goal Five CFTC Performance Measures and Results Goal.Objective.Strategy.Measure
Performance MeasureFY 2011
ActualFY 2012
ActualFY 2013
ActualFY 2013
PlannedFY 2014
PlannedFY 2015
Planned5.1.1.1
Executive approval and Commission adoption of efficient and effective organizational design.100%
Assess and identify organizational requirements. Prepare and design functional organization blueprints. Recommend and obtain approval for new organizational structure.100%
Complete implementation of new organizational structure: identify and hire key leadership positions; assign/re-assign staff to new divisions and offices as required; and, draft new career ladder and associated position descriptions as needed.100%
Use established organizational change procedures to adjust and improve organizational structure as needed.100%
Use established organizational change procedures to adjust and improve organizational structure as needed.N/A
N/AN/A
N/A5.2.1.1
Develop, adopt, and implement a comprehensive planning process.50%
Develop and adopt well-defined and integrated planning process.100%
Track high-level projects; redefine budget activity codes (BPAC).100%
Implement new BPAC; track major projects & activities; implement automated time & attendance.100%
Implement new BPAC; track major projects & activities; implement automated time & attendance.100%
Refine usage of BPAC and automated time and attendance system.100%
Execute FY 2015 Budget on full operational planning; continue budget development and execution on actual resource usage.5.3.1.1
Assess, develop, and implement automated hiring system.100%
Assess and procure best fit system based on CFTC requirements. Develop and/or improve recruitment business processes to maximize efficiency gains from automation.100%
Implement automated hiring system and associated business processes.50%
Optimize automated hiring system and associated business processes. Demonstrate reduction in FTE years dedicated to recruitment and staffing.100%
Optimize automated hiring system and associated business processes. Demonstrate reduction in FTE years dedicated to recruitment and staffing.N/A
N/AN/A
N/A5.3.1.2
Improve time to hire from 150 days to 80 days.79 Days
Improve time to hire by 10% in each of the next five years—saving 15 days.87 Days
Improve time to hire by 10% in each of the next four years—saving 13.5 days.79 Days
Improve time to hire by 10% in each of the next three years—saving 12 days.110 Days
Improve time to hire by 10% in each of the next three years—saving 12 days.99 Days
Improve time to hire by 10% in each of the next two years—saving 11 days.89 Days
Improve time to hire by 10% from previous year—saving 10 days.5.3.2.1
CFTC is consistently rated by its employees as a small agency workplace of choice and listed annually as one of the top ten best places to work in the Federal government (small agency category). CFTC identifies low scores determined to be of most significance to the agency year over year to inform its improvement plans.8 12 24 ≤ 10 ≤ 10 ≤ 10 5.3.3.1
Develop and implement comprehensive development and education program.100%
Design learning plan to include legal, technical, regulatory and specialized training as well as management and supervisory training. Where practical, ensure that programming meets the criteria for continuing education requirements applicable to lawyers and other professionals so that credits may be earned and applied. Implement supervisory training for all new supervisors.100%
Augment and expand in-house legal and technical training to a comprehensive CFTC regulatory training program. Develop leadership and management training curriculum.100%
Increase by 10 to 25% over previous year the percentage of CFTC employees participating in CFTC’s training program as funding and resources available will allow.100%
Increase by 10 to 25% over previous year the percentage of CFTC employees participating in CFTC’s training program as funding and resources available will allow.N/A
N/AN/A
N/A5.3.3.2
Assess requirements, design, and implement a comprehensive CFTC-wide mentoring program focused on enhancing the competencies of CFTC’s current and future workforce.100%
Assess and design program. Pilot program in the Office of General Counsel.100%
Expand mentoring program to other offices and divisions.75%
Increase participation in mentoring program 5-10% over previous year.100%
Increase participation in mentoring program 5-10% over previous year.100%
Survey and compile feedback on mentoring program. Develop program improvement plan based on feedback.100%
Survey and compile feedback on mentoring program. Develop program improvement plan based on feedback.5.4.1.1
Transparency and process maturity of IT governance for reinforcing business unit and IT partnership.100%
Integrate Agency Strategic Planning with IT Strategic Planning.100%
Align IT governance with reengineered BPAC structure.20%
Institute CFTC-wide Data Management.100%
Institute CFTC-wide Data Management.100%
Establishment and sustainment of enterprise target architecture and transition strategy.100%
Mature enterprise architecture and IT governance processes and tools to support continuous CFTC business transformation.5.4.1.2
Implementation of IT strategy and architecture for business continuity.100%
Establish remote data replication of Tiers 1, 2, and 3 to the Commission’s collocation facility.85%
Establish system service support at the collocation facility for Tiers 1 and 2 applications and datasets.100%
Establish system service support at the collocation facility for Tier 3 applications and datasets.100%
Establish system service support at the collocation facility for Tier 3 applications and datasets.100%
Test Business Continuity Operational Headquarters Failover to the collocation facility.100%
Test Business Continuity Operational Headquarters Failover to the collocation facility.5.4.2.1
Implementation of enterprise data management for effective aggregation, correlation with external data, and increased collaboration with other regulators.100%
Develop data management governance and policy framework. Develop enterprise data management roadmap.75%
Establish enterprise data warehouse and service oriented architecture for enterprise data management. Communicate enterprise data warehouse and service oriented architecture design to NFA, SEC, OFR, and other regulators. Integrate FILAC system into enterprise data warehouse.30%
Integrate TSS into enterprise data warehouse. Include swaps data in enterprise data warehouse.100%
Integrate TSS into enterprise data warehouse. Include swaps data in enterprise data warehouse.100%
Integrate ISS into enterprise data warehouse.100%
Link enterprise data warehouse with NFA, SEC, OFR, and other regulatory warehouses.5.4.2.2
Direct Access to SROs and SDRs for effective oversight.92%
Plan dedicated connections to high volume DCMs and SROs.100%
Implement dedicated connections to high volume DCMs and SROs.45%
Receive and process swaps data pushed from existing SDRs.100%
Receive and process swaps data pushed from existing SDRs.100%
Integrate swaps data pushed from existing SDRs with existing systems.100%
Integrate swaps data pushed from existing SDRs with external systems.5.4.3.1
CFTC-wide document and records management and intranet solutions for improved data security collaboration, retention, sharing, and disposal.92%
Automate rule making support. Implement Forensics Lab. Implement website preservation system. Implement CFTCnet. Re-host CFTC.gov to provide improved services.90%
Implement eDiscovery preservation and legal hold. Implement enhancements to document search and retrieval software. Implement Electronic Records Document Management (ERDM) enterprise search and taxonomy and metadata management. Division collaboration sites migrate to/integrate with CFTCnet.90%
Implement automation of enterprise tips, complaints, and referral management. Implement Early Case Assessment System. Implement ERDM workflow and version control (5 process groups).100%
Implement automation of enterprise tips, complaints, and referral management. Implement Early Case Assessment System. Implement ERDM workflow and version control (5 process groups).100%
Implement enhancements to Case Management software. Implement enhancements to audio analytics. Implement ERDM workflow and version control (5 additional process groups).100%
Expand enterprise search to include eLaw and enterprise data warehouse.5.5.1.1
Reengineer, improve, and implement CFTC’s BPACs.100%
Assess and procure reengineering options for BPAC. Design, develop and implement BPAC repository to retain all cost accounting codes.100%
Choose best option for BPAC code structure in line with operating and reporting needs and in light of available resources. Implement new codes for use in FY 2013 budget formulation process.100%
Improve and adapt business processes associated with cost accounting codes.100%
Improve and adapt business processes associated with cost accounting codes.100%
Staff using cost accounting codes properly with error rate documented at less than 1%.N/A
N/A5.5.2.1
Management Control Reviews are conducted and documented. Recommendations are implemented. The Chairman and the CFO are able to give unqualified FMFIA management assurances.100%
Conduct program and administrative risk assessments, prepare three year plan, begin conducting reviews.100%
Update program and administrative risk assessments and three year plan, continue conducting reviews, developing remediation plans, and taking corrective actions.100%
Complete corrective action.100%
Complete corrective action.N/A
N/AN/A
N/A5.5.3.1
Implement web-based time and attendance system.25%
Complete project to modernize Budget Program Activity Code structure and configure WebTA to accommodate.50%
Pilot WebTA.100%
Go live with WebTA.100%
Go live with WebTA.N/A
N/AN/A
N/A -
Performance Measures Considered Not Applicable in FY 2013
Performance Measures Considered Not Applicable in FY 2013 Goal.Objective.Strategy.Measure
Performance MeasureFY 2011
ActualFY 2012
ActualFY 2013
ActualFY 2013
PlannedFY 2014
PlannedFY 2015
Planned1.1.1.1
Implement automated position limit alerts for futures, option, and swaps markets.N/A
Implement automated position limit monitoring for all additional commodities under CFTC position limits for futures and options traded on DCMs.100%
Implement automated position limit monitoring for all commodities under CFTC position limits for the swap market using large trader reporting data.N/A
N/AN/A
N/A100%
Implement automated position limit monitoring for all commodities under CFTC position limits using integrated data from reporting firms and swaps data repositories.N/A
N/A1.1.2.1
Review information requirements of current and proposed forms.50%
Conduct internal review and update current reporting forms. Collaborate with industry committee to develop recommendations for ownership and control information related to exchange-traded futures and options.60%
Implement ownership and control reporting standards for futures and option markets. Implement reportable trader standards for swaps traders.N/A
N/AN/A
N/AN/A
N/AN/A
N/A1.1.3.1
Transmit information and consult with the Office of Information Technology Services (OITS) [Now recognized as the Office of Data and Technology—ODT] to implement electronic filing of forms.50%
Transmit information requirements to OITS for revised trader reporting forms.N/A
Fully deploy electronic filing of trader reporting forms.N/A
Fully deploy information systems for ownership and control reporting. Fully deploy information systems for reportable trader standards for swap traders.100%
Fully deploy information systems for ownership and control reporting. Fully deploy information systems for reportable trader standards for swap traders.N/A
N/AN/A
N/A2.2.1.1
Conduct direct examinations of SDs and MSPs, identify deficiencies and confirm that all deficiencies identified are corrected within specified period of time.N/A N/A N/A 100% 100% 100% 3.1.1.2
The CFTC will bring claims in due recognition of the broadened enforcement mandate provided by the Dodd-Frank Act, and will seek proportionate remedies, including civil monetary penalties, undertakings and restitution, that have the highest impact on and greatest deterrent effect against potential future violations.N/A N/A N/A N/A N/A N/A 4.1.1.2
Regular issuance of outgoing international requests for enforcement assistance and referrals made by the CFTC to foreign regulators pertaining to matters involving their jurisdictions.N/A N/A N/A N/A N/A N/A


